
The US dollar index is at an interesting juncture. The peak in January coincided with a 61.8-percent retracement of the 41.2–percent decline between July 2001 and April 2008. Right now, it has essentially gone sideways the past five weeks, unable to take out 95, which approximates a 38.2-percent retracement of the 15.1-percent decline between January and February this year.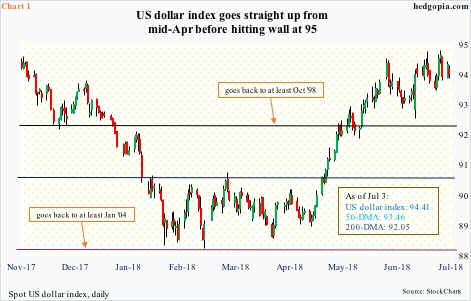
The index hit the wall. Or so it seems.
The US dollar index bounced around support at 88-89 for nearly three months before beginning a sharp rally mid-April (Chart 1). That support goes back to January 2004, so this was important defense as far as dollar bulls were concerned. They went on to also take out resistance at 92-93, which dates back to October 1998.
Having rallied 8.1 percent intraday since bottoming at 88.15 on February 16 through last Thursday’s high of 95.25, digestion of these gains is perfectly natural. But the index is stalling at a crucial technical level.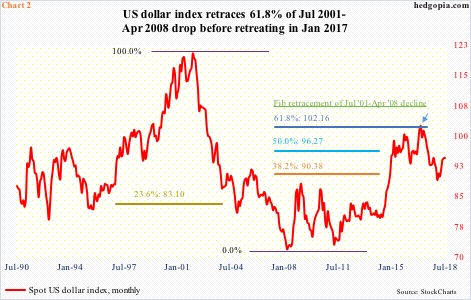
On January 3 this year, the US dollar index began retreating from near important resistance (arrow in Chart 2). The intraday high of 103.81 in that session approximated important Fibonacci resistance. Between July 2001 and April 2008, the index shed 41.2 percent. A 61.8-percent retracement of that drop lies at 102.16, which is about where sellers began showing up. In four weeks through the January peak, the index kept hammering on 103, but it would not give way. The subsequent decline, as mentioned earlier, bottomed mid-February.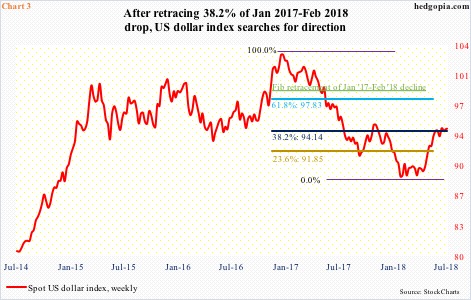
Between the January high and February low, the US dollar index (94.41) fell 15.1 percent. A 38.2-percent retracement of this decline lies at 94.14 (Chart 3). The index has essentially vacillated around this level since late May. On the daily chart, there is room for it go lower. Ditto with the weekly chart, which, should it begin to dictate, can put the index under decent pressure. In the latter scenario, should it drop but find support at the aforementioned 92-93, this will help forge the right side of an inverse head-and-shoulders formation, completion of which could see it rally toward 102-103. Right now, this is a pie-in-the-sky kind of a scenario, but worth keeping in mind, particularly if non-commercials begin to get aggressive.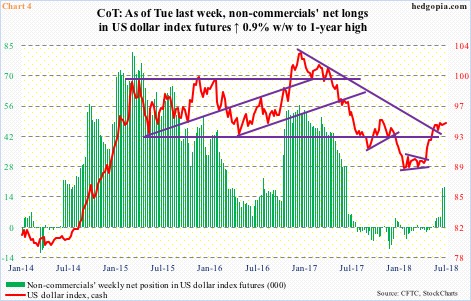
After remaining uncommitted for 10 months, these traders switched to net long US dollar index futures eight weeks ago. In the past couple of weeks through Tuesday last week, the green bars in Chart 4 got taller. For the cash to get further tailwind, they need to grow taller still. This is more medium term.
Near term, the path of least resistance in the cash is continued unwinding of daily overbought conditions.
Thanks for reading!
