
SMH, the Market Vectors Semiconductor ETF, does not act well.
What might be the message for semis in particular and stocks in general?
Before we try to draw an out-and-out negative conclusion from this, let us remember that between the August 24th low ($43.53) and the September 17th high ($51.88) the ETF rallied 19-plus percent. So it is possible it is just digesting those gains.
If that is what is causing the rather lackluster price action in recent sessions, then it is taking place at a crucial juncture.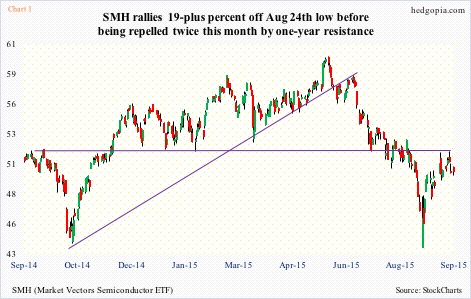
During the August sell-off, the ETF lost major support at $52 (Chart 1), before quickly losing eight points. Post-August 24th low, the countertrend rally to that broken resistance has been fast and furious. This is an overhead supply area. And it is beginning to show up.
Twice in the past nine sessions, SMH retreated sharply from just under $52, the second of which was last Thursday, when stocks staged a big reversal in the wake of the FOMC decision to stand pat. Above all, their macro commentary was not very encouraging.
From this standpoint, the ETF currently is facing a double whammy – not only technical but also fundamental.
In Chart 2, a ratio of inventories to sales (U.S. manufacturing and trade) has been pitted against U.S. banks’ commercial & industrial loans. The ratio has had a steady rise since March 2011 and particularly since July last year (Chart 2). After some back and forth the last several months, July (1.365) is nearly back up to the May high (1.368). In the meantime, there has been a healthy growth in C&I loans, some of which were probably used to finance these inventories.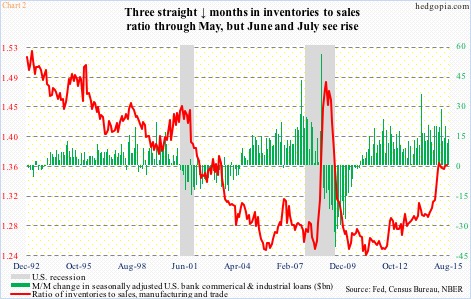
In the second quarter, inventory growth contributed nicely to the upwardly revised real GDP growth of 3.7 percent (not shown here). This is all but set to adversely impact growth in later quarters as this inventory gets digested. As of September 17, the Atlanta Fed’s GDPNow model is forecasting 1.5 percent growth in the third quarter.
Inventory remains elevated even as orders are coming in weak. Chart 3 plots the ratio of new orders to inventories in ISM manufacturing against U.S. recessions. In February this year, the red line did drop to unity, before rebounding. August once again dropped, to 3.2.
Globally, the trade picture is weak. China – essentially a manufacturing hub – saw its exports decline 6.1 percent in August, on the heels of an 8.8-percent drop in July. It can be argued that semis are the modern version of copper – which can be used as a tool to take the pulse of the global economy.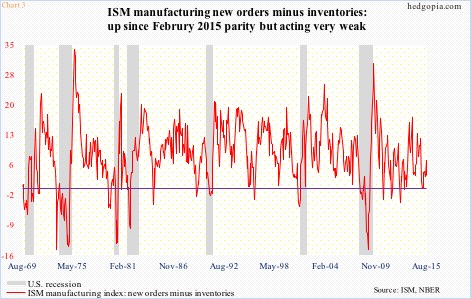
Is this why semis have been acting lackluster of late?
Whether the ETF is catching up to the rather weak fundamentals, digesting the recent gains or is just trading on technicals is not important. What is important is the recent price action can be a sign that some distribution is taking place. If true, this is occurring at a technically important level.
SMH’s top five holdings are: INTC (19.1 percent), TSM (15.6 percent), ASML (six percent), TXN (5.2 percent), and BRCM (4.6 percent).
INTC faced heavy resistance at $30 twice this month. It is still above its 50-day moving average, which is flat to slightly pointing up. It likely gets tested again. On a daily chart, momentum indicators are under pressure…On Thursday, TSM’s rally attempt was scuttled by its declining 50 DMA. Conditions are overbought near-term…ASML too was rejected by its 50 DMA on Thursday, and is probably headed lower…Ditto with TXN…BRCM’s chart looks better, but is in need of unwinding overbought conditions. There were back-to-back dojis the past couple of sessions.
Put it all together and it is not hard to come up with a scenario in which SMH ($50.12) comes under pressure at least in the near-term. The ETF does not have weekly expirations. Hypothetically, using October 50 naked calls it is possible to try to go short near the afore-mentioned resistance. These calls fetch $1.50 each. If called away, it is an effective short at $51.50. Else, the premium is kept. Best-case scenario: The position is closed in a week or two for a profit.
Thanks for reading!
