
An argument can be made that spot VIX is in the middle of a saucer formation – also known as a rounding bottom. Chart 1 shows prior two such formations – one in the ‘90s and the other in the ‘00s. It is possible there is a third one in the making, with the sideways movement taking much longer than in the prior two.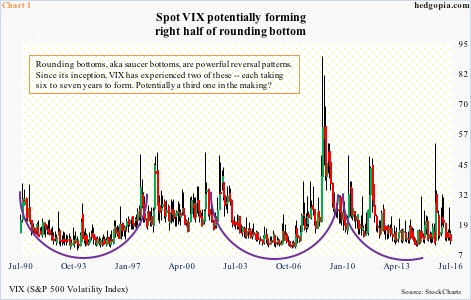
It is not too hard for bears to rationalize a potential saucer formation, which will be completed after a massive jump in volatility. The root cause of the last financial crisis – leverage – has not been solved. Remotely. If anything, it has gotten worse.
Focusing on the U.S., federal debt has grown from $9.2 trillion at the end of 2007 to $19.3 trillion at the end of the first quarter this year. Total debt outstanding has increased from $52.4 trillion to $64.2 trillion during the same period. The Fed’s System Open Market Account holdings have ballooned from less than $500 billion in November 2008 (right before the onset of QE1) to $4.2 trillion now.
All this leverage will come home to roost one day. It is just a matter of when, not if.
If we believe in this premise, then it is entirely possible spot VIX is in the process of forming the right half of a rounding bottom. This is medium- to long-term.
In the short-term, VIX has been under pressure – maybe yet another piece to the process of completion of the saucer bottom in question.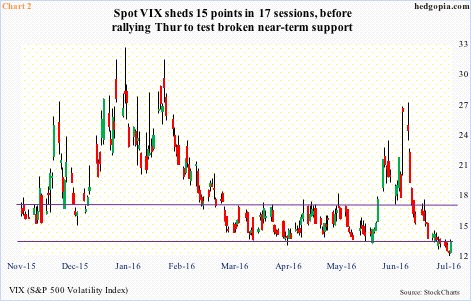
From the June 27th intra-day high of 26.72, VIX dropped 15 points in 17 sessions, in the process breaking near-term support (Chart 2). The rally on Thursday put it right at that broken support.
In the past six sessions, VIX (12.74) has stayed under 13, twice under 12. The last time it traded under 12 was in August last year. In fact, back then it briefly went sub-11, right before surging. But can it go lower?
Realistically, it may be another week or so before VIX begins to look oversold on a weekly basis. The lower Bollinger band has continued lower – currently at 7.96. Several times in the past, after remaining suppressed, VIX has shown a tendency of finding support at the lower band. That said, it is hard to imagine this taking place this time around, unless the lower band begins to rise. VIX’s absolute low was 9.39 in October 2006.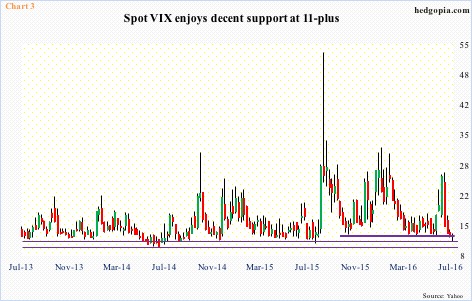
Further, although VIX did break nine-month support this week, there is decent support at just under 12, which was defended yesterday (Chart 3). Given how oversold VIX is on a daily basis, the odds of this support holding near term – or sub-11 in a worse case – are rising.
Medium- to long-term, bit by bit, the right half of Chart 1 is being hammered out.
Thanks for reading!
