
 After having flashed decent enough of a signal last week that volatility was ready to move lower – hence higher odds of higher equity prices – the VIX has indeed pulled back. Equities are rallying; volume could be better, but price action trumps the former at this point.
So where to from here?
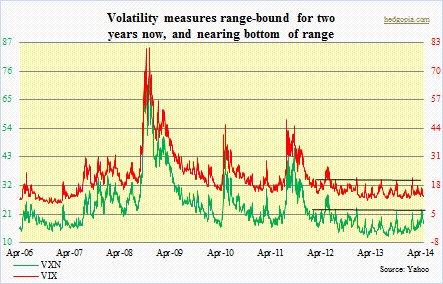
The fear gauge is once again nearing a level that for two years now has consistently found support. In all probability, the SPX should find it very difficult to push past the highs of early this month.
There is not a whole lot of conviction in price action currently. If this thing manages to push higher for lack of selling pressure, and a new high is made, that could cause more technical buying, followed then by selling pressure. Another thing is that, another 10-15 handle, and the SPX will once again find itself in intermediate overbought conditions.
Yes, the Nasdaq is a different story. It came down hard, and has room to move higher in the intermediate term. But the question is, would it, or would it be able to? Prior to the onset of the early-March sell-off, it was acting very strong, led by the biotechs. That momentum is now gone.
Hence, for the current rally to take on a life of its own, it either needs new leaders or the old leaders begin to lead again. The only thing leading right now is energy. The WTI traded at $105 just a few sessions ago. (By the way, the crude wants to go lower – at least in the near-term.) Unleaded gasoline was $3.07 (spot) yesterday, up from $2.49 in November. This is essentially a tax on consumer pocket book.
The point is, as equities push higher off the recent lows, an opportunity to go short could very well be forming here. Not right away. The VIX can still push lower, and equities higher. But a shorting opportunity is on the horizon. I sold my financials — should have probably sold calls against it, but hindsight is always 20/20. I still have the small-caps.
 The VXN is to the Nasdaq 100 what the VIX is to the S&P 500. Except for a brief spike to just under 30 in June 2012, it has consistently found it tough to crack the 20-23 ceiling for two years now. This is similar to the VIX finding resistance at the 18-22 range.
Here is the thing.
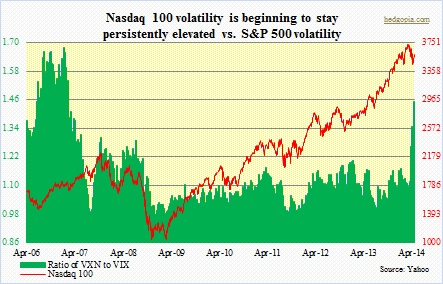
The NDX, of course, is higher beta than the SPX. Early March, when the Naz sell-off began, the VXN/VIX ratio was just a tad over one, and then traded as high as 1.45 last Thursday. It backed down to 1.3 yesterday, but still substantially higher than when the selloff began. Despite the recent rally, Naz 100 investors/traders are gravitating toward protection.
Look at the accompanying chart. The parabolic rise on the right represents the spike in the ratio as the sell-off began early March. And, going back eight years, the only time this ratio has been higher was in 2006 leading up to volatile 2007. Bulls would probably point out that in early 2001 (not shown here) the ratio shot up as high as 3.5. Those were different times, as the Naz bubble was of epic proportions.
