
Following a vertical two-year run, gold just had a very volatile couple of weeks. Bulls failed to hang on to a fresh high $5,608 posted on 29 January, even as bears pushed it all the way down to $4,405 on the 2nd, which was bought. Bulls have their work cut out.
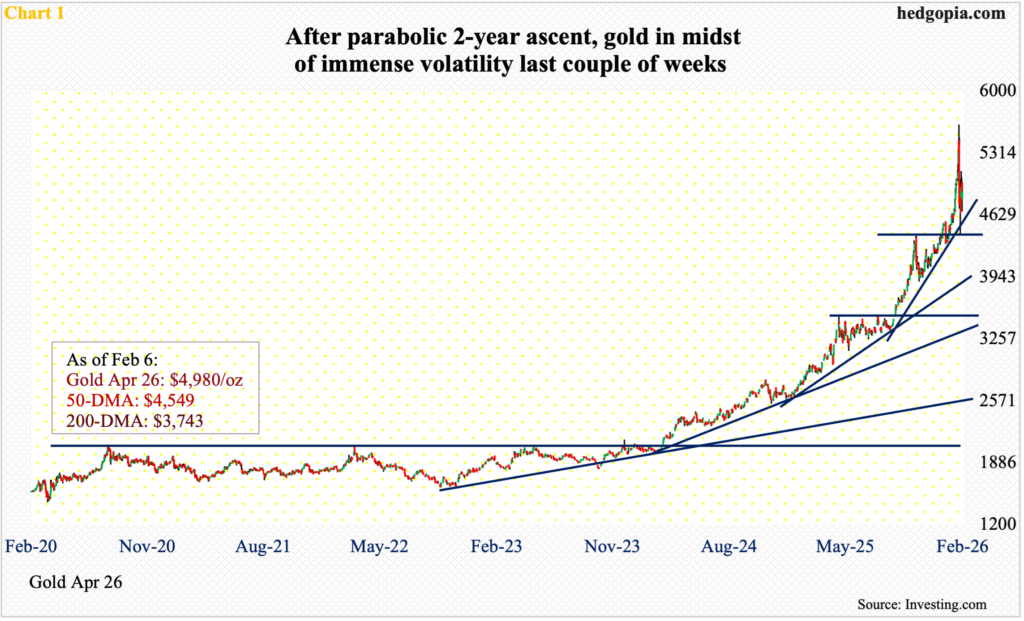
Over three trading sessions between 29 January and 2 February, gold swung over 21 percent between $5,608 and $4,405. Of course, this follows a massive run lasting a couple of years. In October 2023, gold bottomed at $1,810.
Gold had a major breakout at $2,070s in March 2024 (Chart 1). Since then, the metal has gone vertical. Month-to-date, February is up 1.6 percent; if this holds up, the yellow metal would have rallied for seven months in a row; in fact, over 27 months, there have only been five down months.
So, in the big scheme of things, the 11.5-percent drop from its intraday high should not raise the alarm bells, considering gold tripled in just over two years. Last week, it gained 1.6 percent to $4,964/ounce. But, at the same time, gold bugs cannot afford to lose sight of the volatile action since the late-January high.
From their perspective, the good thing is that horizontal support at $4,370s was defended last Monday. If this gives way, the next layer of support lies at $3,900 and then $3,440s, and that is the advantage they have. On the way up, so many resistance levels fell one after the other that those can now act as spots where bids can show up.
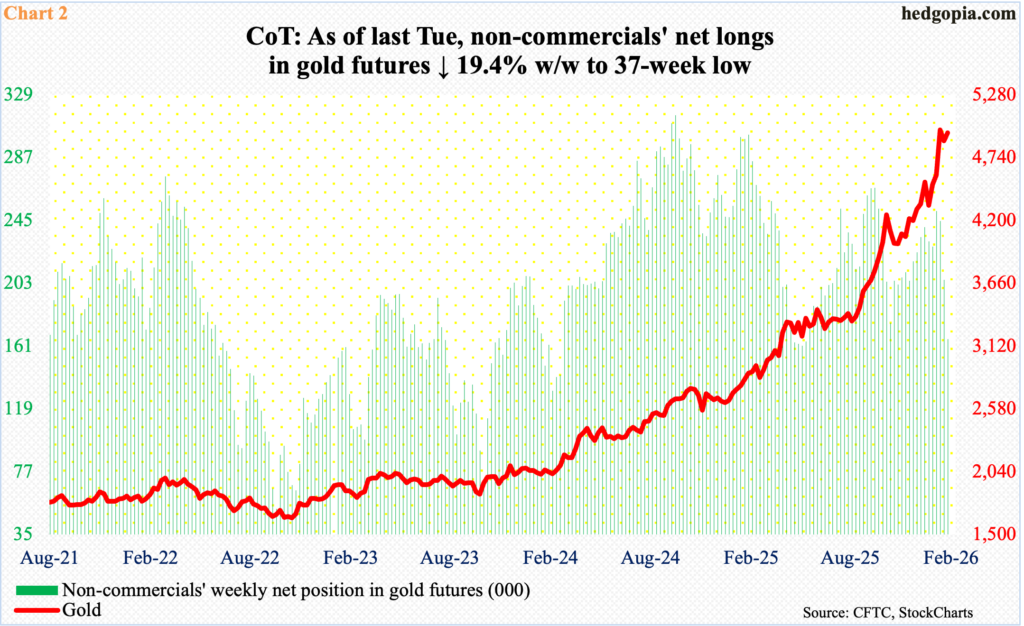
For now, non-commercials are the ones to watch. These futures traders have been on the right side of trade – for the most part anyway. The green bars in Chart 2 began to gain height in October 2022 and again in October 2023; the latter was when gold showed signs of bottoming at $1,800.
By September 2024, non-commercials were sitting on over 315,000 net longs in gold futures, which was the highest since March 2020; back then, in February of that year, they were long just under 354,000 contracts, and that record is to be broken. This, even though the spot has gone on to post one after another high.
Further, since the September 2024 high, non-commercials’ long positions have made lower highs, with the latest occurring on the week to 13 January when they were net long 251,238 contracts. As of last Tuesday, this was further reduced to 165,604 contracts. This can arguably be interpreted as waning enthusiasm for the metal among these traders. How they behave in the coming weeks will be telling, as to if they will treat the latest drop in the spot as an opportunity to add to net long positions.
Kevin Warsh’s nomination to replace the current Federal Reserve Chair Jerome Powell has thrown gold bulls a curve ball. Powell retires in May and was under immense pressure from President Donald Trump to adopt a much looser monetary policy.
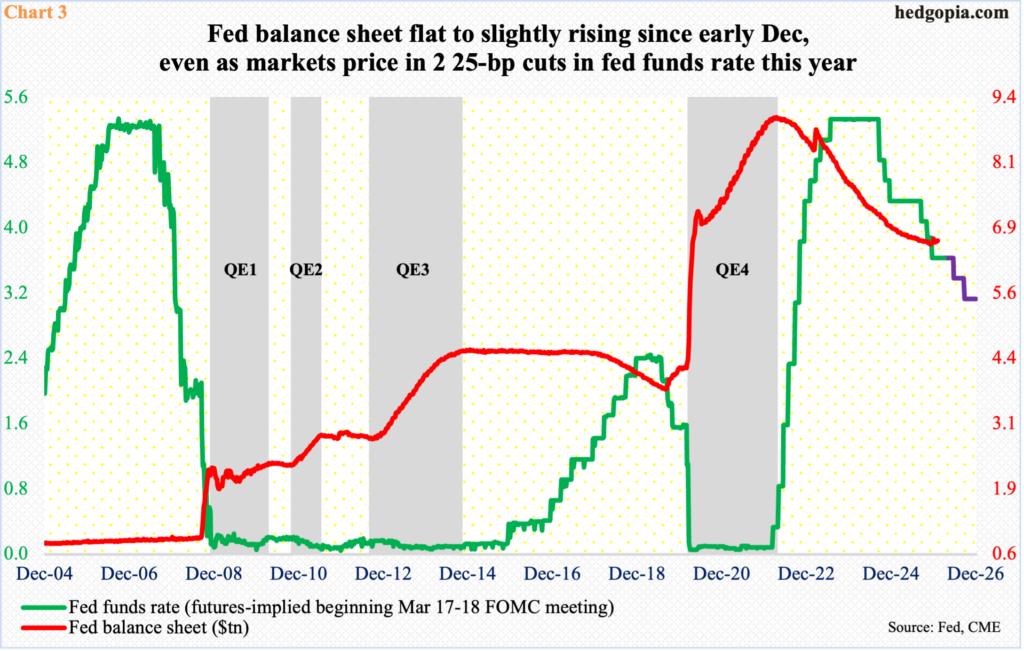
Since last September, the fed funds rate has been reduced by 75 basis points – in three 25-basis-point increments – and by 175 basis points since September 2024. Trump wants lower rates not only on the short end but also on the long end of the yield curve. The Fed has control over the short end of the curve, while long rates, such as the 10-year treasury yield, are priced in the bond market. The Fed can – and does – influence the long end with the help of quantitative easing/tightening; QE is used to expand the balance sheet.
Prior to the financial crisis, the Fed’s balance sheet was under $1 trillion, which, after three iterations of QE, swelled to $4.5 trillion by January 2015. Post-Covid, it once again went vertical, as the Fed began another round of QE, and by May 2022 crested at $8.9 trillion. The subsequent QT put the brakes on the expansion of the balance sheet, which bottomed at $6.5 trillion last December.
The balance sheet has slightly trended higher the past couple of months, reaching $6.6 trillion as of last Wednesday (Chart 3). The Fed is only buying short-term treasury bills currently. In past iterations of QE, it bought large quantities of long-term notes and bonds, helping push rates lower on the long end.
Warsh served as governor between February 2006 and March 2011 and was not a big fan of continued QE during the financial crisis. Hence gold’s volatility the past couple of weeks. If Warsh takes over from Powell come May and maintains his abhorrence for the use of QE as an aggressive monetary tool, then a solid reason to hold gold goes away.
Gold needs profligacy on both the fiscal and monetary fronts. If the central bank under Warsh’s leadership acts disciplined, then it is only the fiscal side that will matter, and in this regard, gold bugs could not be wishing for more.
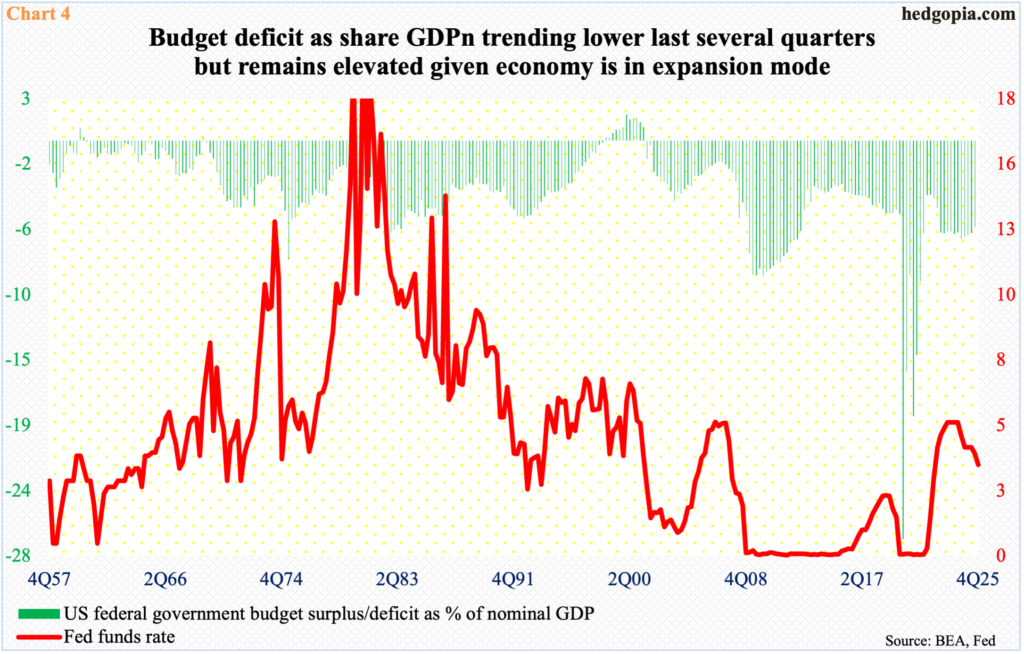
In the September quarter, the US government ran a budget deficit of $1.81 trillion, which equates to 5.8 percent of nominal GDP. The red ink has gone down from a 12-quarter high $1.96 trillion in 3Q24 but remains very high historically. The government tends to run smaller deficits during good economic times, but that has not been the case since the Covid-19 days when the deficit ran as high as $5.36 trillion in 2Q20, subsequently bottoming at $928 billion in 1Q22 before reasserting itself.
The current phenomenon of larger deficits pretty much holds true across the developed world. Gold, as a safe-haven asset, thrives on this. In the December quarter, the US budget deficit probably continued lower toward $1.7 trillion but is likely to head back up in the quarters to come should the historical relationship with the fed funds rate holds up (Chart 4). If this accompanies economic weakness, and the Warsh-led Fed indulges in QE, then this is an ideal scenario for gold to do well. Inability to take out last month’s high in this scenario will have meant gold has peaked.
Thanks for reading!
