Gold is having a golden moment. Relatively, that is. It acts well, but given that it has rallied eight-plus percent in a month, it is probably in need of a breather near-term for its own good.
The metal has had a rough go of it since it peaked in September 2011. Most recently, toward the middle of June, after failing to rally past its declining 200-day moving average it proceeded to lose 11 percent in the next five weeks. What followed was a three-week sideways move, and then a sharp rally.
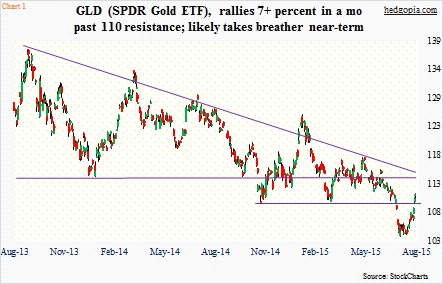
In the process, gold has conquered support-turned-resistance at $1,410. The corresponding support on GLD, the SPDR Gold ETF, lies around $110 (Chart 1). Such has been the momentum behind the yellow metal of late that the ETF filled the July 20th gap-down with ease. Shorter-term moving averages have all curled up. Even the 50-day is now attempting to go sideways.
On Friday, early weakness was promptly bought, as buyers showed up near that $110 support.
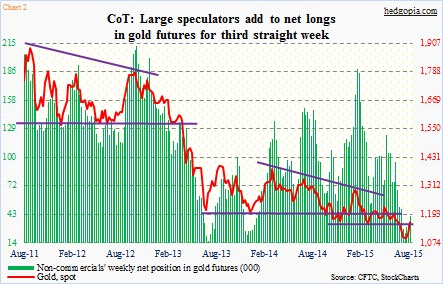
Importantly, non-commercials are once again adding to net longs. This is a group that has ridden the price swings in gold very well. Toward the end of January, they were net long nearly 189,000 contracts. Then they started to cut back. Gold followed, dropping from $1,301 to $1,072 in late July. That was when non-commercials’ net longs bottomed at north of 24,000. Since then, they have added each week. Last week was under 42,000 (Chart 2). And gold is rallying.
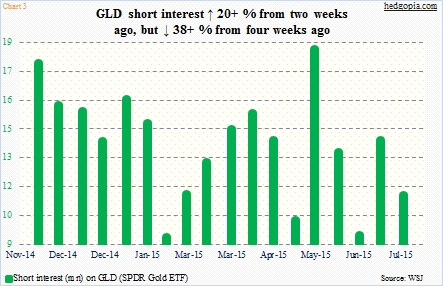
It is possible GLD also got some help from short interest, which is not that elevated, but at 11-plus million it is higher than two weeks ago (Chart 3). The latest short interest report is as of July 31st; the metal started to move up a few sessions after that.
The metal is obviously benefiting from the prevailing risk-off atmosphere in the markets. Did anyone make money last week? Gold bugs, of course, along with bond bulls, and, needless to say, equity bears. China’s yuan devaluation has suddenly thrown financial markets a curve ball, with aftershocks already felt across emerging market stocks and currencies. More pain probably lies ahead. And this should bode well for gold.
But then again, nothing grows to the sky. In the past month, GLD ($111.13) has had a nice run, and is grossly overbought on a daily chart. There is major resistance at $114.50, and a minor one at $112. Looking at a weekly chart, there is tons of room for it to run, but in the near-term things are beginning to look stretched a little.
Longs can use options to position accordingly.
To recall, hypothetically on July 7, July 17th 111 puts were sold for $0.60, resulting in effective long at $110.40. This was then followed by two weekly covered calls earning a cumulative $0.47, reducing the effective cost to $109.93.
Weekly August 28th 110 calls fetch $1.70. These are in-the-money calls. This week, if stocks fail to stabilize, GLD likely gets bid up, no matter how overbought. If it gets called away, it will be at an effective price of $111.70, for a profit of $1.77. If instead the ETF ends the week below $110, then the effective cost drops further – to $108.23 from $109.93.
Thanks for reading!

