
The Nasdaq 100 index enjoyed a mini-breakout Tuesday, only to find itself right underneath seven-month channel resistance. A breakout would be massive. Could shorts come to longs’ rescue in due course?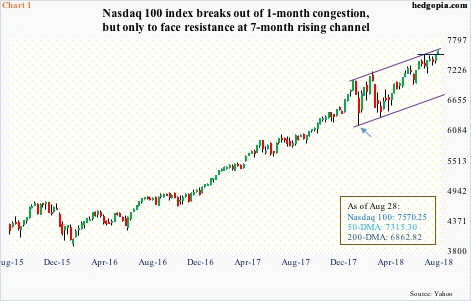
The tech-heavy Nasdaq 100 (7570.25) Tuesday rose to yet another high. Through the session’s intraday high of 7588.72, it was up 18.6 percent for the year. Monday, the index broke out of one-month consolidation. This followed consistently higher lows since the February low (arrow in Chart 1).
The 1.1-percent move week-to-date also puts the index right underneath channel resistance, which goes back to late January this year. In the very near term, digestion of these gains is the path of least resistance. In the past couple of sessions, the index closed above the daily upper Bollinger band. Conditions are overbought, with some weekly momentum indicators way extended. The channel resistance likely holds near term.
But what if? What if the index in due course breaks out of the channel? Since late June, the 50-day moving average has been tested twice, and on both occasions bulls stepped up. The average lies at 7315.30, which also approximates two-plus-month support at 7300. A test looks imminent near term. If the average is once again defended, will shorts give up? Better yet for the bulls, will shorts be squeezed enough to sling the index out of the channel?
This is not a base case on this blog, but it does not hurt remaining cognizant of its possibility. Short interest remains high.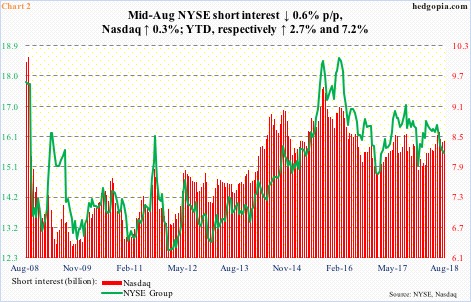
By mid-August, Nasdaq short interest is up 7.2 percent this year, versus a 2.7-percent rise on the NYSE Group. Shorts are increasingly tempted by the peer-beating rally in the Nasdaq, which is well ahead of its major US peers. Year to date, the Composite is up 16.3 percent. In contrast, the Russell 2000 small cap index is up 12.6 percent, the S&P 500 large cap index up 8.4 percent, and the Dow Industrials up 5.4 percent.
At 8.4 billion by mid-August, Nasdaq short interest is not as elevated as during September 2015 or February 2016, but high enough (Chart 2). Last year, as stocks began to rally in Q4, short interest fell from 8.5 billion mid-September to 7.8 billion by the end of December. This is what the bulls are hoping for, provided they can force a squeeze.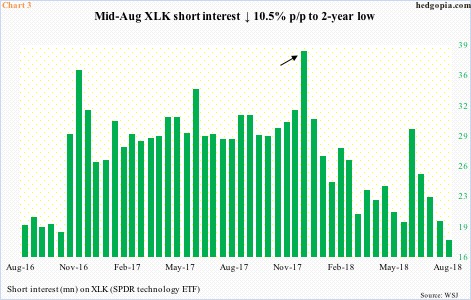
On a smaller scale elsewhere, shorts have already gotten squeezed. Post-presidential election in November 2016, short interest on XLK (SPDR technology ETF) began to accumulate. At the time, traders gravitated toward small-caps, not so much tech. The latter began to rally as 2017 began. Shorts were hurting but stayed put. By mid-December last year, XLK short interest had increased to 38 million (arrow in Chart 3). Then began the squeeze. By the end of January, short interest had dropped to 23.8 million, and, has continued lower. Mid-August, it fell 10.5 percent period-over-period to 17.5 million. 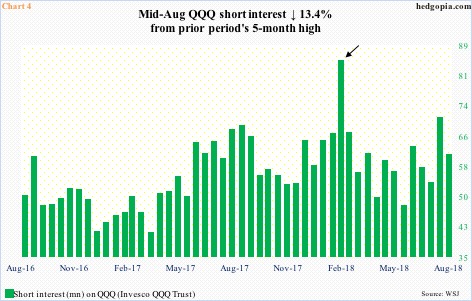
Also on QQQ (Invesco QQQ Trust), mid-August short interest dropped 13.4 percent p/p to 60.7 million. Mid-February, when the ETF – and US stocks in general – was in the process of bottoming, short interest had shot up to 84.6 million (arrow in Chart 4). This subsequently provided a big tailwind to QQQ/Nasdaq 100, as shorts gradually turned tail. The current level of bearishness is not that high, but there is still room for short squeeze provided bulls can force one.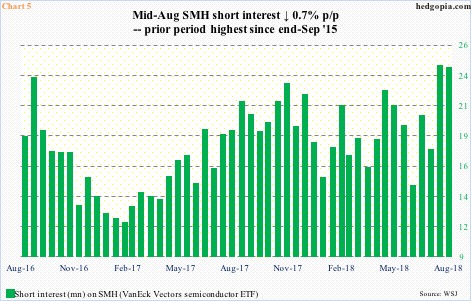
From a squeeze perspective, SMH (VanEck Vectors semiconductor ETF) probably offers the biggest opportunity. Mid-August, short interest inched down 0.7 percent p/p to 24.1 million, but the prior period was the highest since end-September 2015 (Chart 5). This is potential fuel for squeeze, should shorts begin to give in. They very well might, if the ETF goes over a technical hurdle it is currently facing.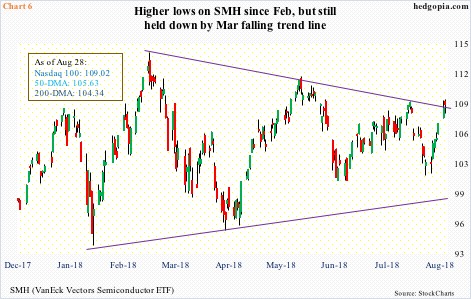
On March 12, SMH (109.02) rallied to a new intraday all-time high of 114.55. Since then, it has consistently made lower highs, even as support at 95-96 has been successfully tested. A trend line drawn from that high extends to 108-109.50, depending on how it is drawn. The ETF is currently sitting on it (Chart 6). In fact, arguably it has broken out, although not very convincingly. Should a genuine breakout occur, shorts might be tempted to cover. This will help the Nasdaq 100/Nasdaq composite. Will this be enough for the aforementioned channel breakout on the Nasdaq 100? That is a tough one to call. In all probability, for that to occur, we might need to see Nasdaq shorts begin to bail out, in such a way as to kick in a self-fulfilling prophecy.
Thanks for reading!
