
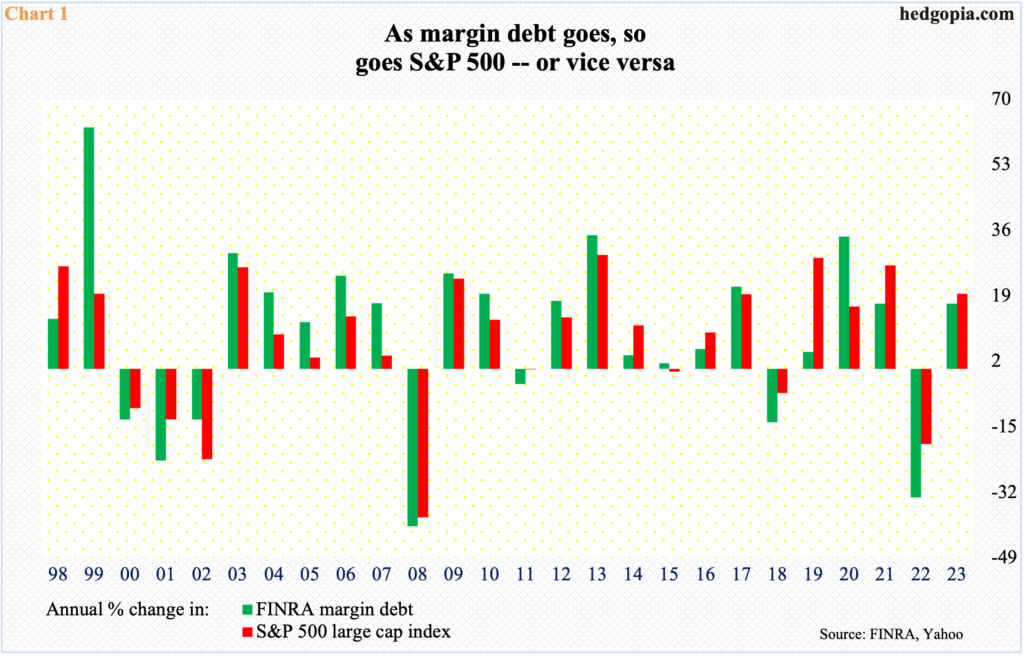
Margin debt is tightly correlated with the major US equity indices, with the former up nicely from its low of last December, although the willingness to take on margin debt is nowhere near as strong as was the case in the months leading up to the record high from October 2021.
FINRA margin debt was up 4.2 percent in July, even as the S&P 500 rallied 3.1 percent. This was the fifth month in a row the large cap index rose month-over-month. During those five months, margin debt rose in four and dropped in one, with April going its own way.
The two do not necessarily go in unison month in month out. But annually, they maintain a tight correlation. Chart 1 goes back to 1998, and in all those years, 2015 is the only one in which the two diverged, with margin debt rising 1.6 percent and the S&P 500 shrinking 0.7 percent; in the rest, they moved hand in hand.
Year-to-July, margin debt is up 17 percent, and the S&P 500 added 19.5 percent. August is proving difficult for the large cap index – down 4.8 percent thus far. If the month finishes anywhere near the current level, odds favor margin debt will reciprocate.
July’s $709.8 billion set a 14-month high, up $102.3 billion from last December’s 30-month low of $606.7 billion. Through that low, margin debt tumbled 35.2 percent (by $329.2 billion) from the all-time high of $935.9 billion posted in October 2021. Both the Nasdaq composite and the Russell 2000 small cap index peaked in November that year, even as the S&P 500 did so in the following January. They all bottomed last October, with margin debt troughing in December.
At July’s high, the S&P 500 was 4.6 percent from its all-time high, while the Nasdaq composite was 12.2 percent from its (although the more concentrated Nasdaq 100 was 5.2 percent from its all-time high). July’s margin debt, in contrast, was still 31.8 percent from its record high – suggesting the bulls are not as enthusiastic to take on leverage this time around as they were in 2021.
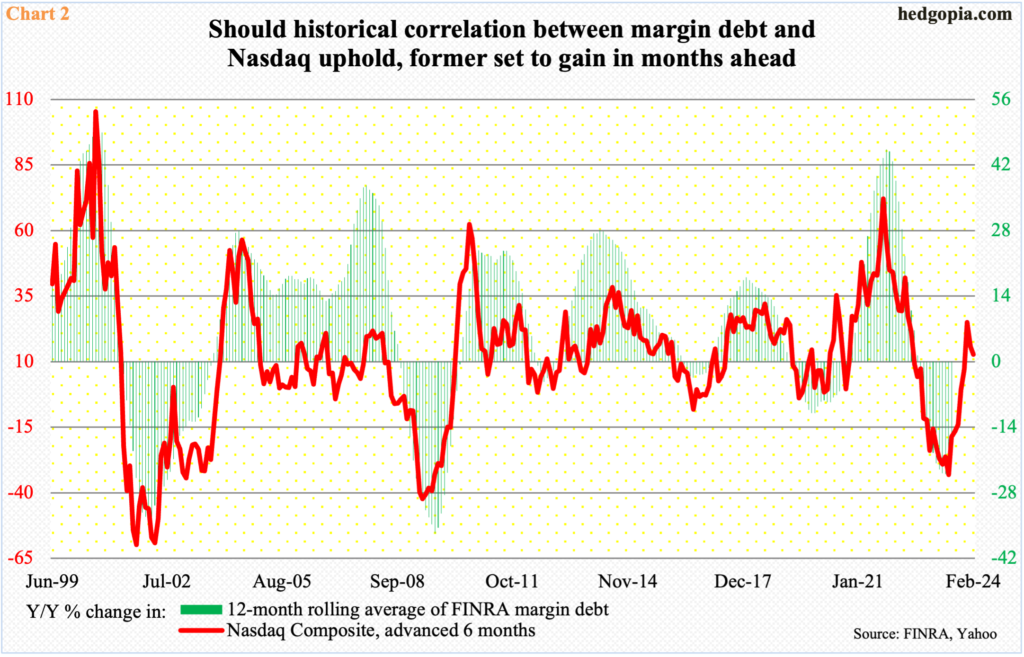
Unwillingness – or reduced willingness – to take on margin debt is a negative as far as the bulls are concerned, unless this gets offset by some other sources.
With that said, Chart 2 offers some consolation for the bulls. It plots the year-over-year percent change in the 12-month rolling average of margin debt against the Nasdaq composite which is advanced six months. In May, the green bars bottomed at down 24.1 percent, before improving in June and July. If past is prelude, and should the two variables maintain their historical relationship, the green bars are on track to gradually shift upward in the months to come.
Thanks for reading!
