
Rates are rising – probably not enough to seriously hurt sectors such as housing, but will in due course if the momentum continues.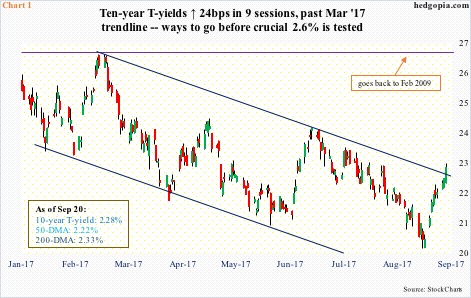
In merely nine sessions, 10-year Treasury yields have gone up by 24 basis points to 2.28 percent, past the 50-day moving average and a trend line from March this year.
In a larger scheme of things, the backup in yields is not that big of a deal. As early as mid-March, yields peaked at 2.61 percent (Chart 1). But on a relative basis, this is quite an increase, particularly if bond vigilantes continue to re-price the yield curve.
Pre-FOMC meeting, yields were already rallying, and rallied more post-statement Wednesday.
Beginning October, the Fed plans to start shrinking its massive portfolio of mortgage-backed securities and Treasury bonds/notes by $10 billion/month, rising every three months until monthly reductions reach $50 billion.
It will be some time before the planned reductions make a serious dent in the $4.5-trillion balance sheet, but markets can react early.
If sustained, the rise in yields would potentially have come at a crucial time for housing.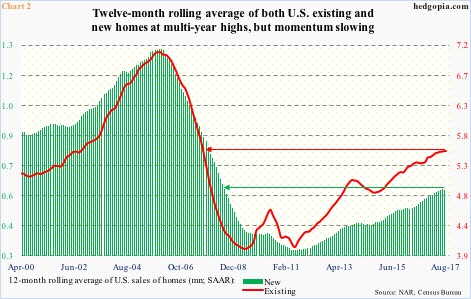
U.S. home sales are holding up but off cycle highs.
In August, sales of existing homes fell 1.7 percent month-over-month to a seasonally adjusted annual rate of 5.35 million units. March’s 5.7 million units were the highest since February 2007.
August’s new home sales are due out next Tuesday. July was down 9.4 percent m/m to 571,000 units (SAAR). They, too, peaked in March at 638,000 units – the highest since November 2007.
Chart 2 plots these sales on a 12-month rolling average basis – momentum is beginning to flatten out, if not downshift.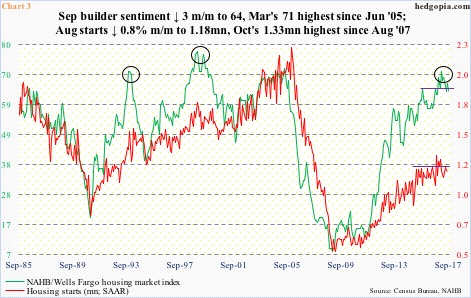
From housing bulls’ perspective, the good thing is that supply remains well-behaved, with months’ supply at 4.2 for existing (August) and at 5.7 for new (July). Although both have been rising – existing was 3.5 in January and new at 4.3 in March.
The rather subdued level of supply primarily owes to housing starts that remain relatively well-anchored. Builders sound excessively bullish in surveys, but do not put money where their mouth is.
In September, the NAHB housing market index slid three points m/m to 64. Sentiment peaked at 71 in March – the highest since June 2005.
In the meantime, housing starts in August fell 0.8 percent m/m to 1.18 million units (SAAR). They peaked at 1.33 million units last October, which was the highest since October 2007 (Chart 3).
One of the by-products has been upward pressure on the price.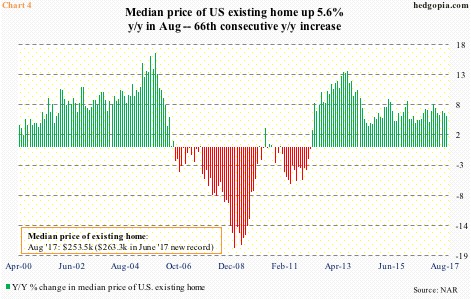
In August, the median price of an existing home rose 5.6 percent year-over-year to $253,500, with June a record at $263,300. This was the 66th straight month of annual increase (Chart 4).
(The median price of a new home peaked at $332,700 last December, with July at $313,700.)
This sustained increase in home prices is a deterrent as far as affordability goes.
Income growth is already sluggish. Average hourly earnings of private-sector employees rose 2.5 percent y/y in August. The last time they rose north of three percent was in April 2009.
Currently, both income and price are more of a headwind than a tailwind. Low interest/mortgage rates have been a tailwind, but can change if momentum shifts in 10-year yields. There is a ways to go before this happens, but risk rises if bond bears take out multi-year resistance at 2.6 percent, which resisted rally attempts in both December last year and March this year.
Thanks for reading!
