
Equity bulls are in command. From last October’s low through Thursday’s high, the S&P 500 is up north of 29 percent. Several indicators that looked panicky back then are approaching the other extreme. At this juncture, investors face a much bigger hurdle than traders who by nature are good at jumping ship.
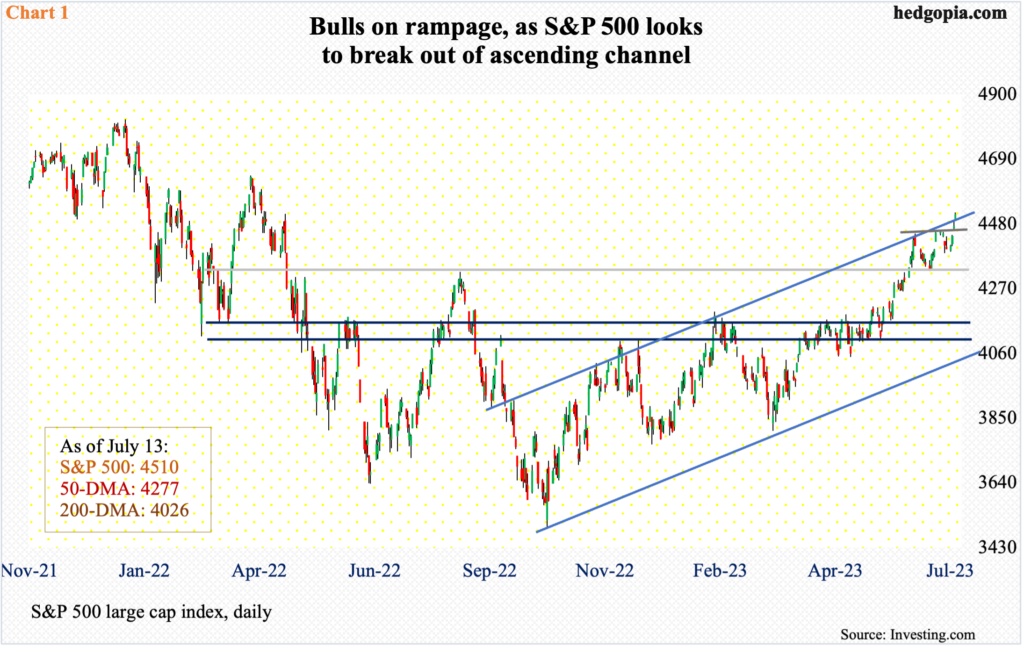
Equity bulls are on a rampage. With a day’s trade left, the S&P 500 is up 2.5 percent for the week. From last October’s low through Thursday’s high, the large cap index is now up 29.4 percent to 4510.
A successful breakout retest at 4320s on June 26 has further emboldened the bulls. This was a high from last August and was reclaimed on June 12. On Wednesday, the index enjoyed another mini-breakout at 4450s, poking its head out of an ascending channel (Chart 1).
Conditions remain overbought, with the daily RSI at 70.72, and the weekly at 67.96 just short of 70, but momentum is intact.
In the options market, traders continue to accumulate far more calls than puts. On Thursday, CBOE traded 2.21 million calls versus 1.06 million puts, for an equity-only put-to-call ratio of 0.48. And this has gone on for a while now.
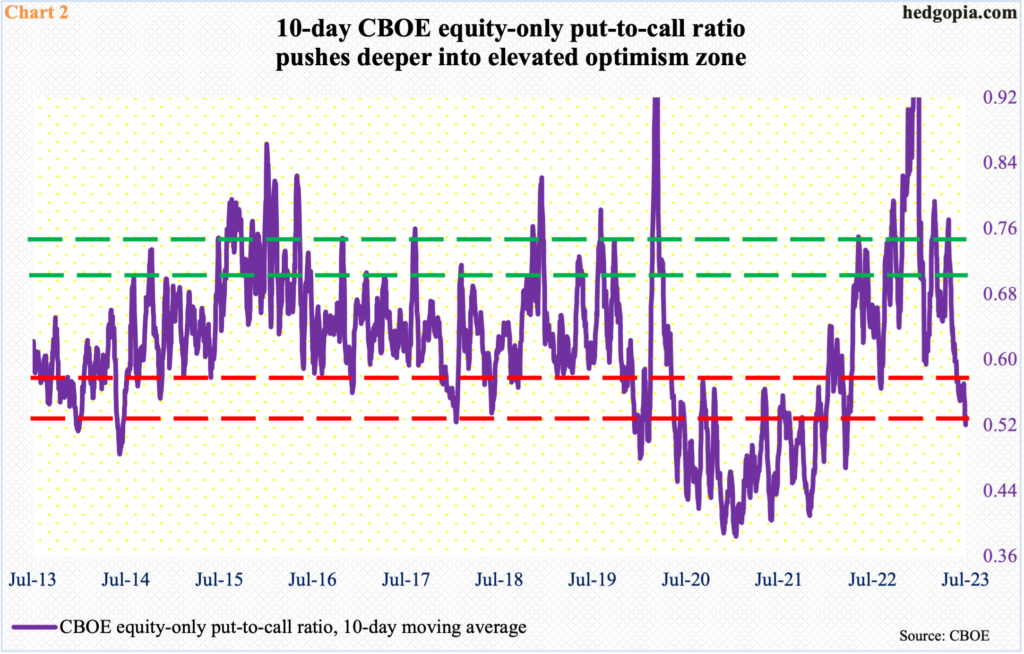
The 21-day moving average of the ratio dropped to 0.545 on Thursday, which was the lowest since April last year. On a 10-day basis, the ratio hit 0.521 in that session; this, too, was the lowest since April last year.
The current level of elevated optimism is evident in Chart 2, with the 10-day average of the ratio pushing further into overbought territory.
That said, nothing says this cannot continue.
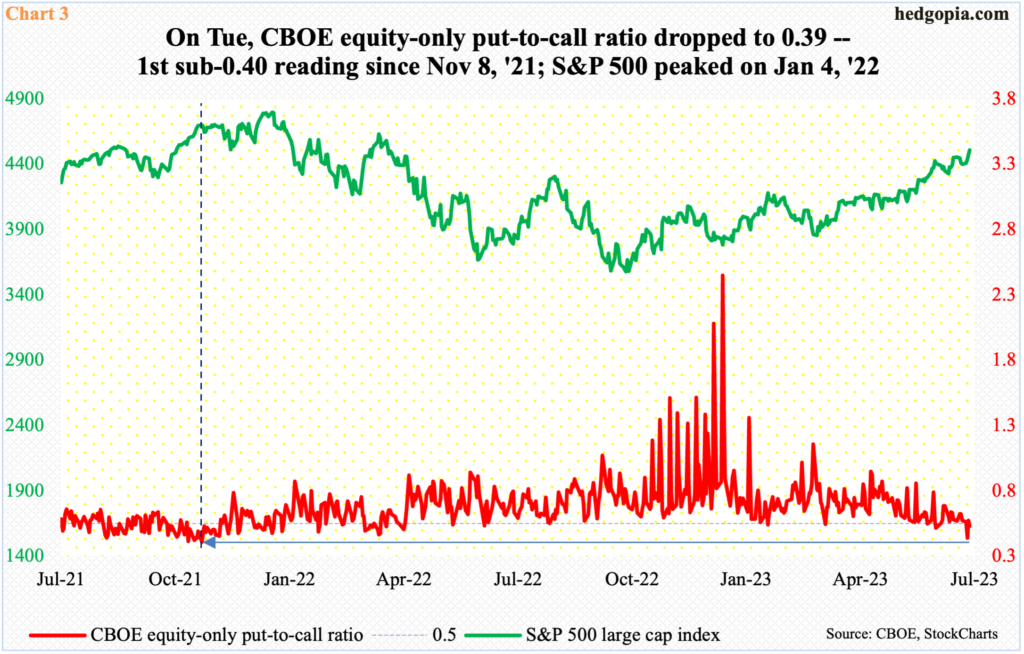
Tuesday’s 0.39 was the first sub-0.40 reading since November 2021. The S&P 500 was at 4702 then (dashed vertical line in Chart 3). Leading up to, as well as after, that, there were several 0.40 and 0.50 readings. Barring a slightly down November, the S&P 500 kept rising until it reached a new all-time high of 4819 the following January and then collapsed. From the January high to October’s trough at 3492, the index tumbled 27.5 percent.
The lesson here is that overbought can remain overbought for an extended period of time, but the longer the condition persists, the steeper the price to pay later.
As things stand, both traders and investors have done well from last October’s low. But, going forward, this is likely to change.
Traders are traders. They are trend followers. Once the current positive momentum breaks and goes the other way, they will follow suit. Investors are a different breed. They do not have the same luxury – or the skill set. Any investor that goes in now and holds, hoping for a good return on a sustained basis, is likely to come up short. The panic of last October has been replaced by fearlessness. A sort of ‘nothing can go wrong’ attitude is in the air. This can persist a while longer, no doubt, but the 10-day average in Chart 2, for instance, can only go so low, before it reverses higher.
Thanks for reading!
