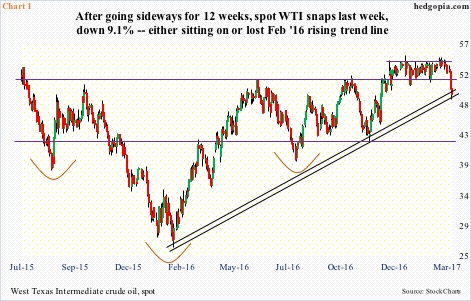
Spot West Texas Intermediate crude had a lousy last week, collapsing 9.1 percent as well as losing both 50- and 200-day moving averages.
On a closing basis, it also lost the rising trend line from the lows of February last year when oil bottomed at $26.05/barrel. On an intraday basis, it is sitting on that trend line (Chart 1).
Last week’s action preceded 12 straight weeks of doji-filled consolidation. Bulls were hoping this was part of a continuation pattern. After it bottomed in February last year, WTI had more than doubled. The sideways action also occurred above support at $52, which the bulls consistently defended – until last week. All along, they could never convincingly take out resistance at $54-plus. Nor could they take advantage of a potentially bullish inverse head-and-shoulders formation.
Now that the consolidation has been resolved with a breakdown, a question arises as to where to from here?
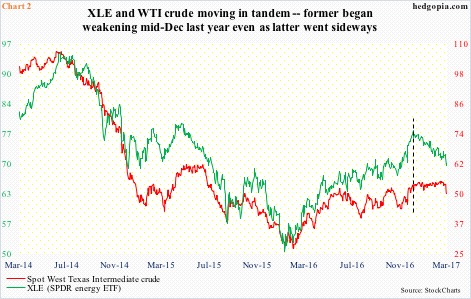
Not surprisingly, XLE, the SPDR energy ETF, tends to track crude oil. It so happens that this time around it led the decline in crude. The ETF peaked on December 12 last year, even as oil had just begun to go sideways (dashed vertical line in Chart 2). XLE has been trading within a declining channel since.
From this respect, the ETF is worth watching. It closed Friday just under the 200-day moving average. The 50-day and shorter-term averages are still pointing lower. So even if it begins to attract bids, it will take time for it to stabilize.
Ditto with oil. It closed under the 200-day last Friday.
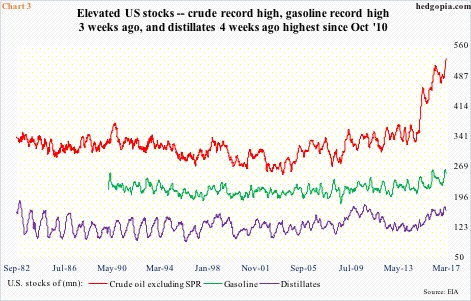
It is hard to pin down on what exactly caused the crude selloff last week. It sold off big on Wednesday, when the weekly EIA report showed U.S. crude inventory continued to build.
In the past several weeks, although crude inventory had been persistently accumulating, traders focused on declining stocks of both gasoline and distillates, which respectively peaked at 259.1 million barrels (February 10, a record high) and 170.7 million barrels (February 3, highest since October 2010). Last week, they fell 6.6 million barrels to 249.3 million barrels and 2.7 million barrels to 161.5 million barrels, in that order. But the fact remains that they remain elevated (Chart 3).
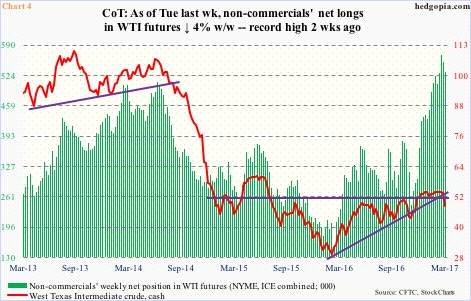
How oil trades near term is likely a function of how non-commercial futures traders behave. They are heavily net long WTI futures.
As of last Tuesday, non-commercials were net long 531,989 contracts, down slightly from record high 553,981 contracts in the prior week. In Wednesday through Friday last week, spot WTI dropped 8.8 percent with high volume, slicing through support. This has all the footprint of big money leaving.
Non-commercials have been gradually building since oil bottomed in February last year (Chart 4). They probably cut back last week. We will find out when latest numbers are reported this Friday. But last week’s price action and loss of support has the potential to continue to negatively impact their psyche, raising odds that they would continue to unwind.
In this scenario, worse, the next level on spot WTI ($48.49) to watch is $42, which is where it traded last November, and can be extended as far back as May 2004. That low was before OPEC reached an agreement on November 30 last year to cut production, which led to a 9.3-percent rally in that session to $49.44. Which means oil currently is trading lower than that reaction high.
Thanks for reading!

