
One look at the red line in Chart 1, and it is easy to see what crude oil has been through in the past year and a half.
Intra-day, off the June 2014 high through last week’s sub-$35/barrel low, spot West Texas Intermediate crude lost 68 percent. For oil bulls, the waterfall crash through January this year in particular was painful.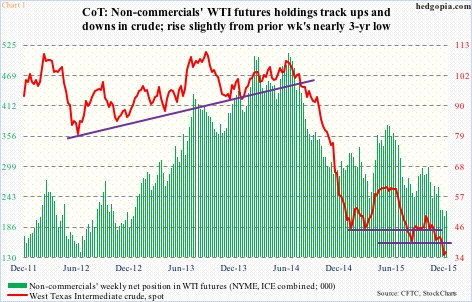
It is anyone’s guess as to where oil might be headed next year. Throughout the year-and-a-half ordeal, every time crude looked like bottoming, the bottom fell out of it. In the process, resistance is galore.
Thus far, trying to catch a bottom has been like trying to catch a falling knife. It is not even worth trying. Unless one nimbly traded.
Countertrend rallies always happen.
Spot WTI jumped 48 percent between March and May this year, and 35 percent between August and October after that. Although both those lows have subsequently been undercut.
One group that have done a good job of riding the ups and downs in the crude are non-commercial futures traders. Along with the spot, Chart 1 plots their WTI holdings. Net longs peaked a week after the spot peaked back in June last year. And in the aggregate they have been cutting back since.
Two weeks ago, non-commercials held 207,260 net longs – the lowest since December 24, 2012. Last week, they added some. It is too soon to say if this is the beginning of a trend or just a head fake. But this is taking place even as spot WTI is trying very hard to stabilize.
Last week, the WTI produced a doji. That said, four weeks ago, there were back-to-back weekly dojis, and the crude went on to make fresh lows. The latest one is coming in the midst of weekly momentum indicators that have now been pushed into oversold zone. Ditto on a daily basis.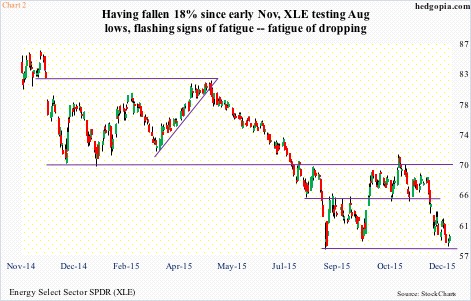
XLE, the SPDR Energy ETF, shows similar trend. On a daily chart, Monday produced a doji. From high to low since early November, the ETF dropped 18 percent, and is currently testing the August lows (Chart 2). There could not be a better time for at least a respite.
XLE stabilizing here will be making a statement of sorts, for fundamentally there is not much improvement.
Chart 3 plots U.S. crude production with inventory. The former peaked in June this year at 9.61 million barrels per day, and has gradually dropped since. In the December 11th week, production was 9.18 mbpd. For reference, just seven years ago, production was just under five mbpd.
In the latest week, crude stocks (excluding the strategic petroleum reserve) were 490.7 million barrels, essentially on par with the all-time high of 490.9 million barrels in the April 24th week.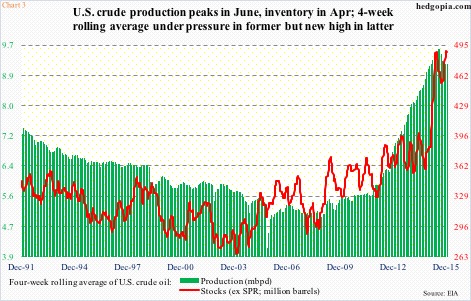
In Chart 3, a four-week rolling average has been calculated. Crude stocks just made a new high, even as production is coming under slight pressure.
Hence despite the collapse in the price of crude and a two-thirds decline in rig counts, production has continued to chug along, and with it stocks.
It is tough to get wildly bullish about the crude/XLE. Especially so as both are in need of consolidation. Shorter-term moving averages have not even begun to flatten, let along turn up.
That said, the ETF is beginning to act as if it is itching to move up – at least near-term.
Given this, it is probably not a bad place to get long XLE ($59.54) for a trade. With a buy-write twist.
Hypothetically, December 31st 60.50 calls fetch $0.57. If it is called away, this will ensure a profit of $1.53. Else, the cost effectively drops to $58.97. Incidentally, the 10-day moving average lies at $60.44. Odds favor the ETF finds some resistance there – at least initially.
Thanks for reading!
