
XLV ($81.58) peaked at $84.31 on October 23, with the month producing a monthly reversal candle. Monthly indicators are way overbought. Longer-term, there is plenty of room for downside pressure.
Medium- to near-term, things are a little different.
After that peak last month through the low of $80.44 on the 15th this month, XLV lost 4.6 percent, in the process also losing the 50-day moving average. It is still under that average.
That said, the bulls did step up this month to defend crucial support.
Since June this year, the bulls and bears have fought a real tug of war at just under $81. This support was defended several times this month. Ditto with a rising trend line from April this year (chart below).
In the meantime, the daily MACD just had a potentially bullish crossover.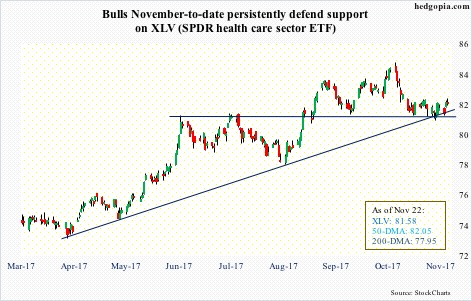
Assuming this support holds, XLV likely has a neutral to slightly up bias near term. In this scenario, using options, a bull put spread is a good fit – better than an outright long call or a debit call spread. Below is a hypothetical example.
XLV Dec 2017 (expires 22nd):
- Sell in-the-money 82 put for $1.28
- Buy out-of-the-money 80.50 put for $0.58
This amounts to a net credit of $0.70.
Upside profit potential is limited. As is downside risk, since it is not a naked short put. Risk is defined.
If, let us say, by expiration the ETF closes above the higher strike, both options expire out of the money. The premium – $0.70 – is kept.
If, on the other hand, XLV closes at $80, then both options end up in the money. In this scenario, the maximum loss possible is $0.80, with breakeven at $81.30.
These are decent odds – a potential loss of $0.80 versus potential income of $0.70.
Risk rises if the horizontal support as well as the rising trend line mentioned above on the underlying is lost.
Thanks for reading!
