
XLY, the SPDR consumer discretionary ETF, acts well. It just broke out to a new high, as did its top three holdings – Amazon (AMZN), Home Depot (HD), and Comcast Corporation (CMCSA). These three make up 12.7 percent, 7.3 percent and seven percent of the ETF’s holdings, for a cumulative 27 percent.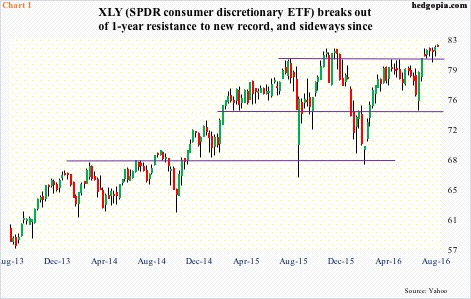
A month ago, XLY broke out of sideways pattern going back to last November. As has been the case with major U.S. indices, it has gone sideways since (Chart 1). The ETF is now overbought on nearly all timeframes, with daily upper Bollinger band currently providing resistance.
The sideways move can resolve itself by breaking down as much as by breaking out. When the ETF began to rally six weeks ago post-Brexit, technicals were in favor – daily and weekly in particular. That tailwind is now gone, although momentum is not yet broken. Fundamentally, of course, there have been holes all along.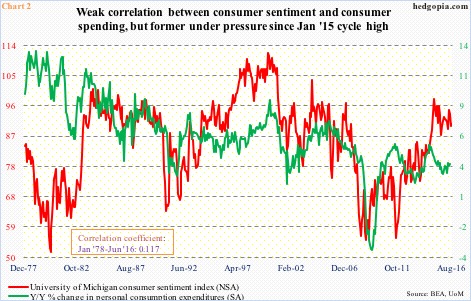
The University of Michigan’s consumer sentiment index inched up four-tenths of a point in August to 90.4. The cycle high was reached in January 2015 at 98.1, which was an 11-year high. Chart 2 plots consumer sentiment with year-over-year change in personal consumption expenditures (PCE). There is not much correlation between the two – mere 0.12 going back to January 1978.
But the fact remains that throughout the current business cycle, sentiment has never crossed 100. Relative to corporate capital expenditures, consumer spending is holding its own. That said, in a larger scheme of things, PCE remains suppressed. In October 2014, spending grew at an annual rate of 5.1 percent, matching the pace of May 2011. Since then, the growth rate has decelerated, with June growing at 3.7 percent to a seasonally adjusted annual rate of $12.7 trillion.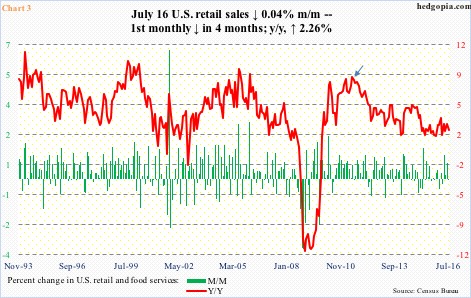
Retail sales show a similar trend. July inched down 0.04 percent month-over-month to a seasonally adjusted annual rate of $457.7 billion. This was the first monthly drop in four months. In August 2014, sales were growing at 5.2 percent annually. This July, growth slowed to 2.3 percent. In fact, growth in annual sales began to decelerate after hitting 8.3 percent in June 2011 (arrow in Chart 3).
Within retail sales, the category known as ‘building materials, garden equipment & supply dealers’ has essentially gone sideways since last December. July was down 0.5 percent to a seasonally adjusted annual rate of $29.3 billion (not shown here). This likely casts doubt on recent strength seen in sales of homes.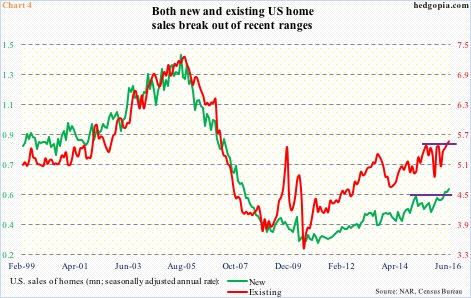
Sales of both existing and new homes have broken out of recent ranges (Chart 4). In June, new home sales jumped 3.5 percent m/m to a seasonally adjusted annual rate of 592,000 units – the highest since February 2008 – and existing homes rose 1.1 percent to a seasonally adjusted annual rate of 5.57 million units, which were the highest since February 2007.
Along with sales, the median price of an existing home rose to a new record $247,700 in June, while in new homes the record was set in April at $320,000 (not shown here). This in and of itself should act as a sales deterrent in due course.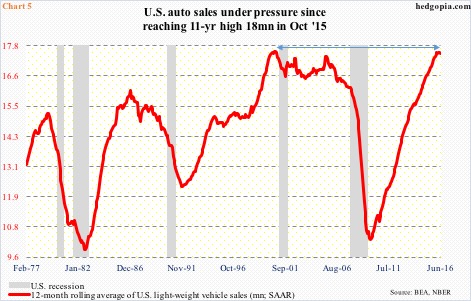
We may be beginning to see early signs of deceleration in auto sales. Sales of light-weight vehicles peaked last October at a seasonally adjusted annual rate of 18 million. By June this year, this had decelerated to 16.7 million. The October 2015 peak was the highest since July 2005. Sales fell to as low as nine million in February 2009. They have come a long way.
Chart 5 presents a 12-month rolling average of auto sales, and on this basis, they have just begun to roll over. The February 2016 high of 17.54 million essentially matched the all-time high 17.58 million reached in September 2000.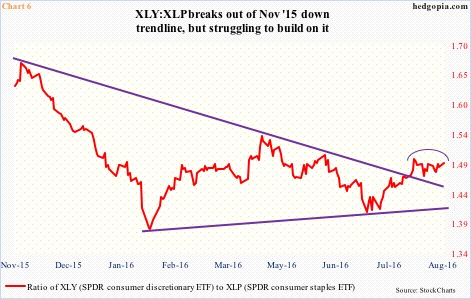
It is probably due to all this XLY has lagged its consumer staples cousin, XLP, for a while now. Most recently, the ratio between the two peaked last November. Three weeks ago, it broke out of a downtrend line drawn from that peak, but is struggling to build on it (Chart 6).
But because XLY ($82.16) has just broken out, and acts well technically, it is drawing investors’/traders’ interest. The only thing that is going in favor of the ETF is its price action, which in many respects is what matters … until it does not.
Intuitively, risk-reward odds do not favor going aggressively long XLY.
Thanks for reading!
