
XLY (SPDR consumer discretionary ETF) saves a potential breakdown – for now, and just in time.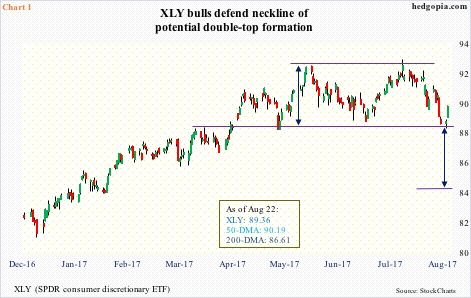
On June 5 this year, XLY (89.36) rallied to 92.14, before retreating. Seven weeks later, on July 27, it rallied to 92.55, only to once again come under pressure. This was a potential double top formation, and would complete if $88 gave way (Chart 1).
Monday, the bulls stepped up to the plate, buying early weakness in a heavy-volume, hammer session. This was followed by further strength Tuesday.
If the neckline broke convincingly, technicians would be eyeing $84.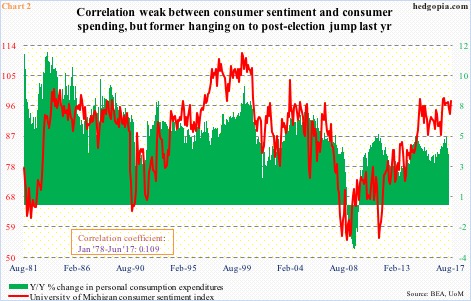
For that to transpire, consumer sentiment probably needs to weaken by a good amount.
Chart 2 plots the University of Michigan’s consumer sentiment index with year-over-year change in U.S. personal consumption expenditures (PCE).
Sentiment jumped 4.2 points month-over-month in August to 97.6 – not that far away from January’s 98.5, which was a 13-year high. Sentiment jumped post-election last year. In October, the index read 87.2.
The correlation coefficient between the variables in Chart 2 is not very strong, but directionally they do seem to move together. Growth in PCE in June (the latest month for which data is available) decelerated to 3.8 percent from 5.1 percent in March, but is nothing to sneeze at.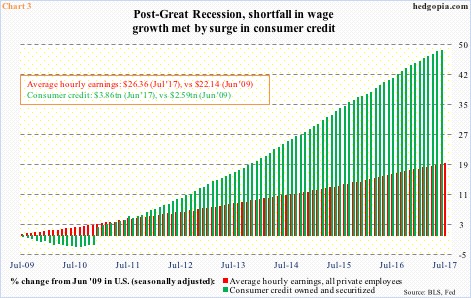
Leverage goes a long way.
U.S. consumer credit grew 5.7 percent y/y in June to a seasonally adjusted annual rate of $3.86 trillion. Growth has decelerated from a seven-percent pace two years ago, but in an otherwise low-growth environment this still remains healthy growth (Chart 3).
In fact, private-sector average hourly earnings in July merely grew 2.5 percent y/y. The last time wages rose with a three handle was in April 2009, when Great Recession was on its last legs.
In the aggregate, since the recession ended, average hourly earnings went up 19.1 percent, and consumer credit 49 percent. This mismatch has gone a long way in sustaining consumer spending.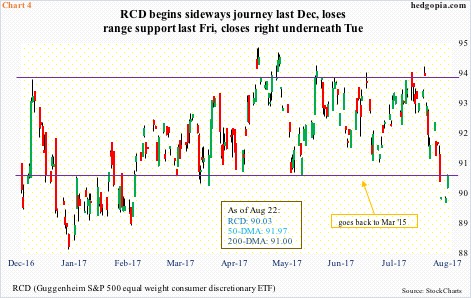
The question is, how much longer can this go on?
Even as consumers are increasingly relying on credit, earnings growth is in deceleration.
Last year, operating earnings of S&P 500 consumer discretionary companies grew 9.4 percent (courtesy of S&P Dow Jones Indices). Growth has been decelerating since 12.8 percent in 2013. This year, it is expected to decelerate further to 4.1 percent.
Hence the importance of the neckline in question on XLY. Speaking of which, RCD (Guggenheim S&P 500 equal weight consumer discretionary ETF) already fares slightly worse than XLY.
XLY’s top five weights include Amazon (AMZN), 15.1 percent; Comcast (CMCSA), 7.7 percent; Home Depot (HD), seven percent; Walt Disney (DIS), 5.9 percent; and McDonalds (MCD), 5.1 percent, for a total of 40.8 percent.
RCD weights each stock equally. The top-five account for 7.7 percent. But since it avoids concentration in large firms – which is the case in XLY – it provides a different perspective.
Unlike XLY, RCD began to go sideways last December. Down below, there was support at north of $90, which got taken out last week, with Tuesday closing right underneath (Chart 4). Evidently, the rally in XLY is led by the heavy-weights. Not all are participating.
This divergence in due course gets resolved one way or the other. The onus is on the bulls to make sure the double-top formation on XLY does not complete.
Near term, XLY can rally, but odds favor the neckline will be tested again.
Thanks for reading!
