
The Fed is selling its treasury holdings, foreigners are buying. Non-commercials are shorting 10-year note futures, the US budget deficit is narrowing. Amidst these supply-demand dynamics, the 10-year T-yield is at risk of forming a potentially bearish technical pattern.
The Federal Reserve is in a tightening mode and is using both conventional and unconventional tools to withdraw liquidity.
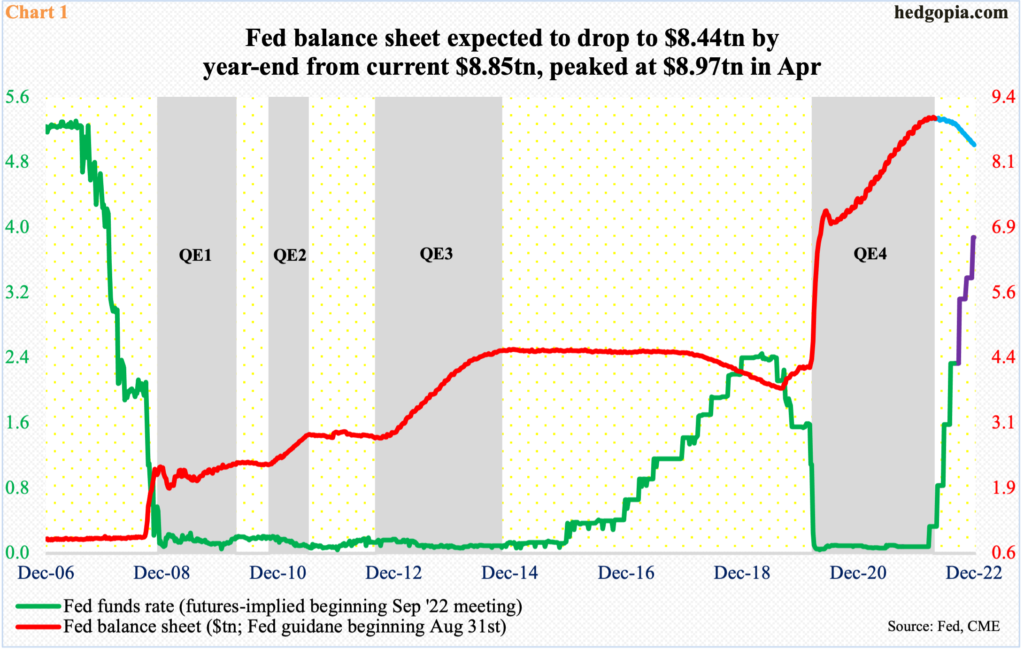
The fed funds rate has been raised four times this year to a target range of 225 basis points to 250 basis points. In the remaining three FOMC meetings this year, the benchmark rates are expected to reach between 375 basis points and 400 basis points.
Concurrently, the central bank aggressively began to expand its balance sheet in the early months of 2020. From a low of $4.24 trillion in early March that year, it more than doubled to $8.97 trillion by April this year. As of Wednesday last week, it was down to $8.85 trillion and is on its way down in the months/quarters ahead (Chart 1).
Currently, the Fed holds $4.87 trillion in treasury notes and bonds, down from record $4.95 trillion in April. In March 2020, this was merely $2.03 trillion. As the pace of reduction in these securities accelerates, rates on the long end on the treasury yield curve can rally – at least on theory.
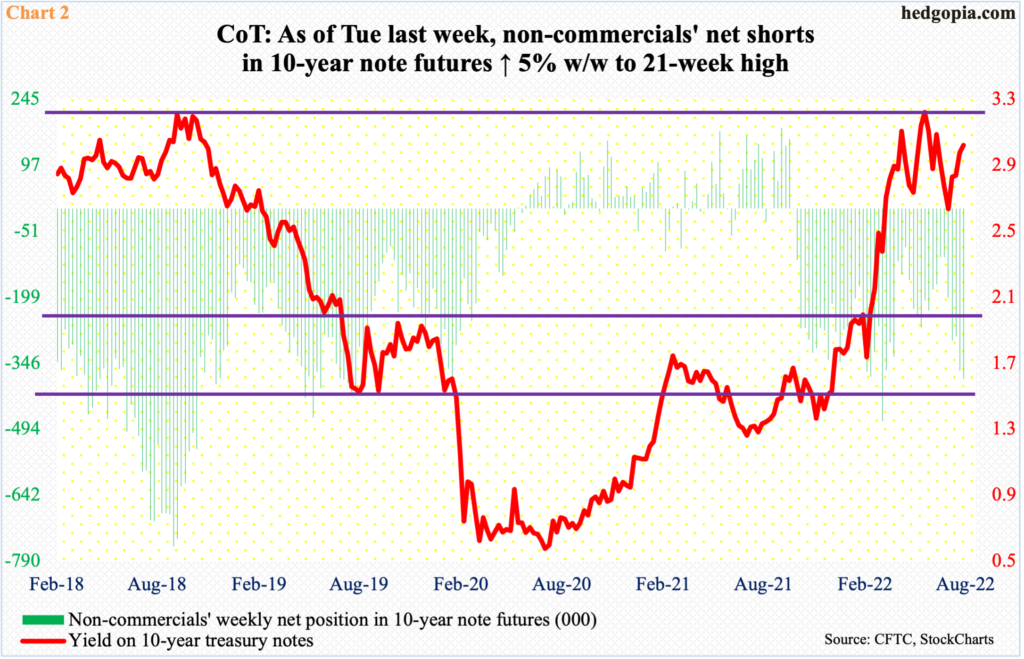
In fact, this is probably one reason why non-commercials are heavily net short 10-year note futures, expecting higher yields as the supply of these securities rises.
As of Tuesday last week, these traders were sitting on 381,169 contracts in net shorts – a 21-week high. They have gotten very aggressive in recent weeks, as they were only net short 108,371 contracts in the week to July 12 (Chart 2).
However, there are a lot of other variables in these supply-demand dynamics.
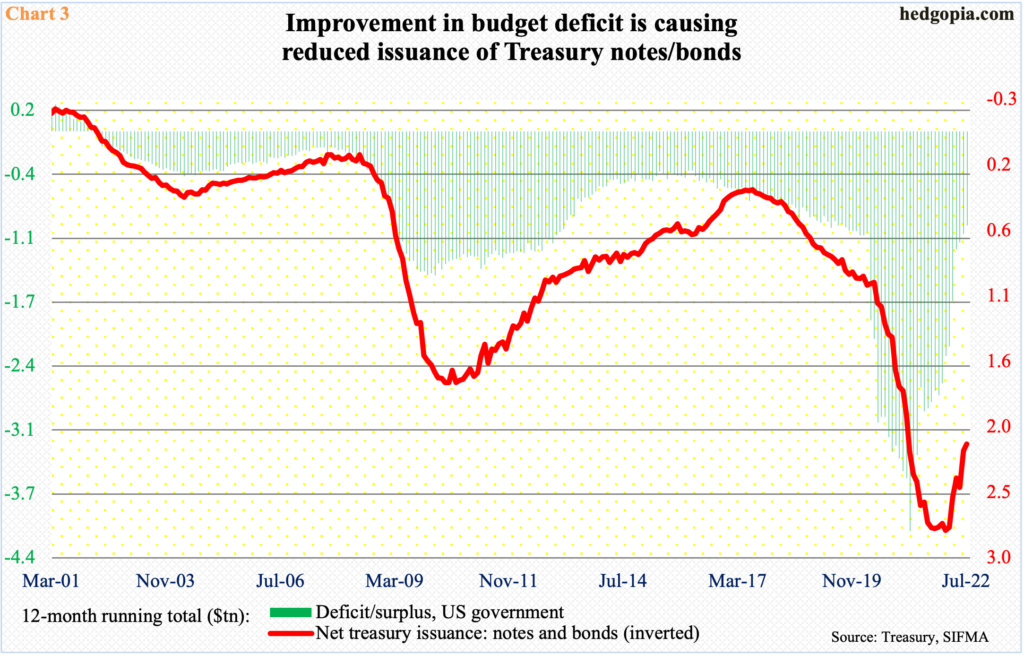
The US government has run deficit for two decades now. In the wake of Covid-19 disruptions in early 2020, the red ink began to expand. In March that year, the 12-month total of deficit was $1.04 trillion; one year later, this was $4.09 trillion, before improving. In July, the metric went sub-trillion, coming in at $961.7 billion (Chart 3).
This also meant reduced issuance of debt by the Treasury. On a 12-month basis, the issuance of treasury notes and bonds peaked at $2.76 trillion this January; in July, this was down to $2.14 trillion.
In the meantime, foreigners are picking up the slack.
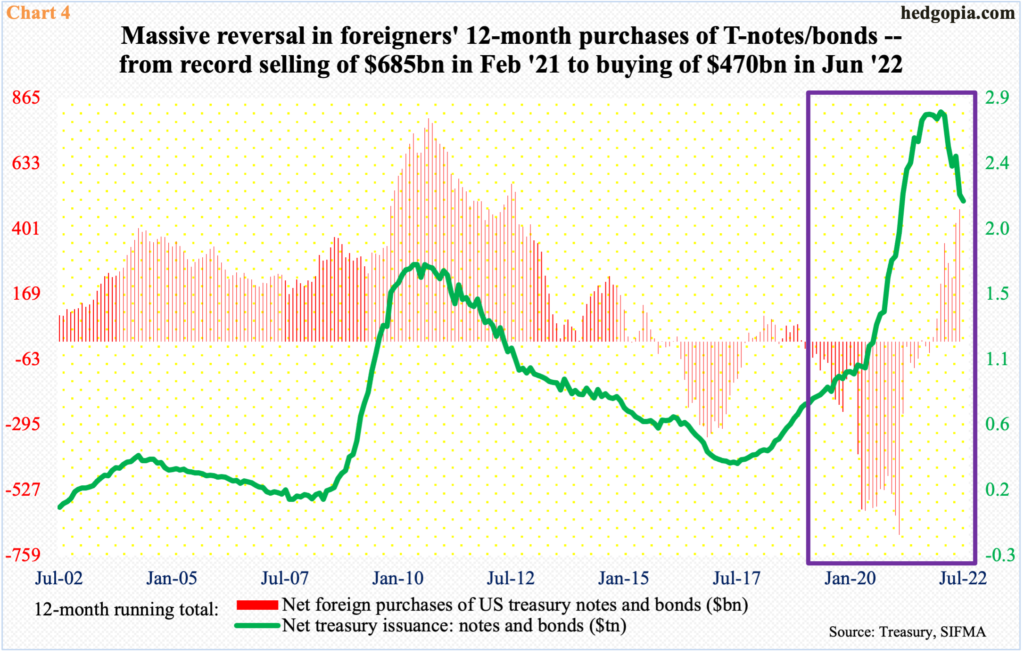
The 12-month total of net foreign purchases of treasury notes and bonds came in at $470 billion in June. This is a massive U-turn on their part as until last October they were net sellers. In fact, a record $685.1 billion in these securities was sold in February last year (Chart 4).
Now, they are heavily net long. If past is prelude, their activity is worth watching.
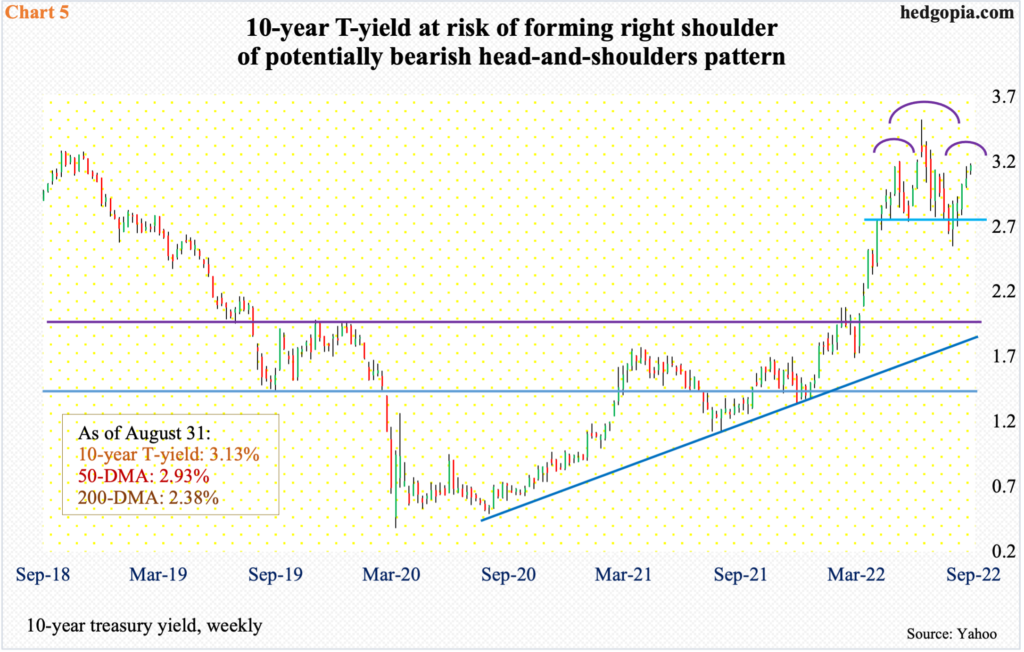
Amidst all this push-and-pull, the 10-year treasury yield finds itself at a crucial juncture. If bond bulls, such as foreigners, had their way, yields could be forming a potentially bearish technical pattern.
On June 14, the 10-year retreated after tagging 3.48 percent. Before that, rates ticked 3.17 percent on May 9. These two can represent the left shoulder and the head of a head-and-shoulders formation. Bond bulls have an opportunity here to forge the right shoulder (Chart 5).
On Tuesday, the 10-year yielded 3.15 percent, before weakening a tad, with Wednesday closing at 3.13 percent.
The daily is extended and, in the right circumstances for bond bulls, can begin to unwind its overbought condition. In this scenario, the neckline lies at low-2.70s, a decisive break of which can act as a self-fulfilling prophecy, leading the likes of non-commercials to cover their short bets.
Thanks for reading!
