
Small-cap bulls once again were forced to defend the lower bound of the 1700-1900 range in place since January last year. The Russell 2000 just does not respond to the optimistic growth forecasts in earnings for this year and particularly next year.
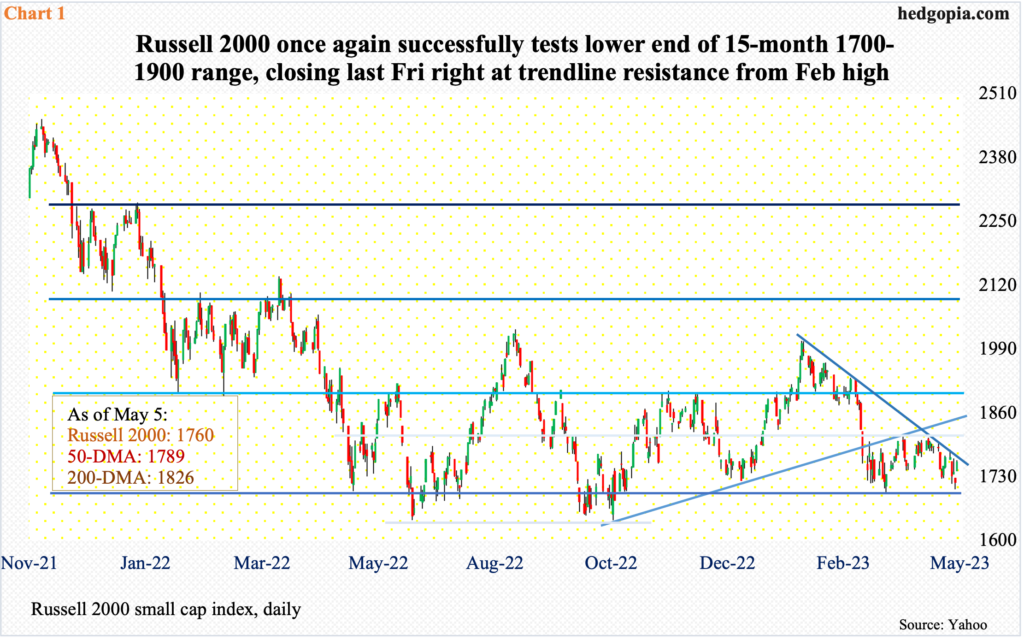
Yet again, 1700 was tested on the Russell 2000. This has been an important price point for bulls and bears alike going back to August 2018. Particularly since January last year, the small cap index has gone back and forth between 1700 and 1900.
Since May last year, 1700 has been tested several times – twice just since the index retreated after tagging 2007 early February this year (Chart 1). Except for a brief drop to 1640s last June and October, which was bought, small-cap bears have been unable to force a breach of 1700 on a sustained basis.
Last Thursday’s drop to that support drew buying interest as well, closing out the week at 1760 – right on a falling trendline from February’s high. Immediately ahead, bulls probably have the edge. A takeout of that trendline opens the door toward at least 1800 – the mid-point of the range.
The Russell 2000 peaked as far back as November 2021 at 2459. It is still down 28.4 percent from that high.
Small-caps inherently have a larger exposure to the economy versus their large-cap brethren, which also have foreign exposure. Small-caps often are used as a way to measure the pulse of the economy. From this respect, they are either not responding to the current state of the economy or expect worse to happen in the quarters to come.
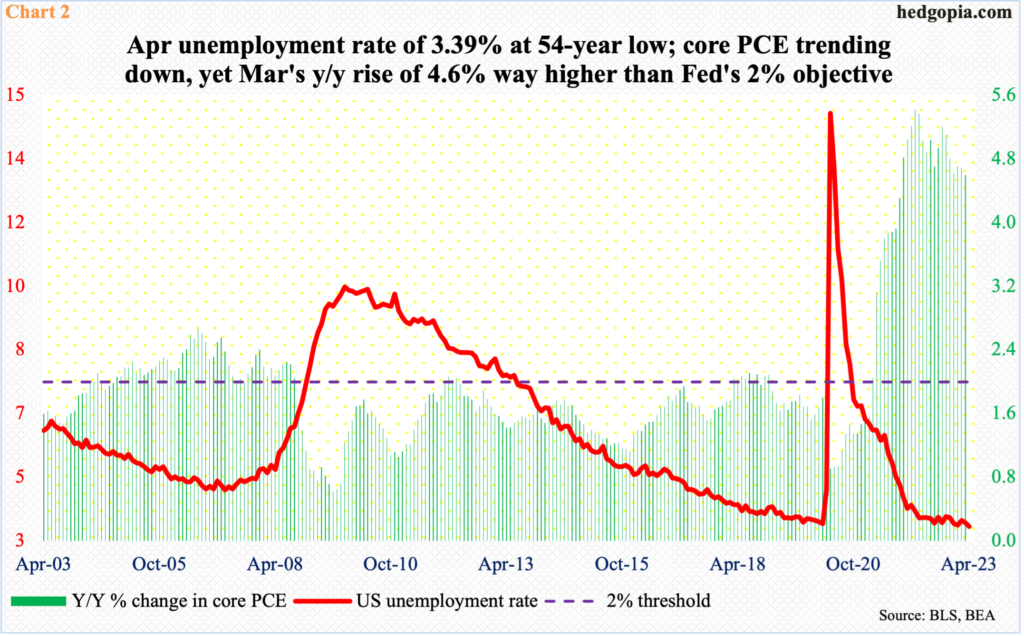
Right here and now, the economy added 253,000 non-farm jobs in April, which was better than expected. Noticeably, the unemployment rate dropped to 3.39 percent, which was a 54-year low (Chart 2).
As good as the present looks, there are definite signs of deceleration in the jobs market. Non-farm job openings in March came in at 9.59 million, down from a high of 12 million in March last year. Back then, there were two openings for every unemployed; in March, this was down to 1.6 – still respectable but on a downward slope. Concurrently, initial unemployment claims are beginning to pick up. Further, in the first four months this year, 285,000 jobs were added on average, down from the 2022 monthly average of 399,000 and 606,000 before that in 2021.
Responding to the still-elevated consumer inflation, which is trending lower from last year’s four-decade highs but remains way above its two percent objective on a core basis (Chart 2), the Federal Reserve raised the fed funds rate by 500 basis points in under 14 months. In March last year, the benchmark rates were languishing in a range of zero to 25 basis points; with last week’s 25-basis-point increase, they are now between 500 basis points and 525 basis points.
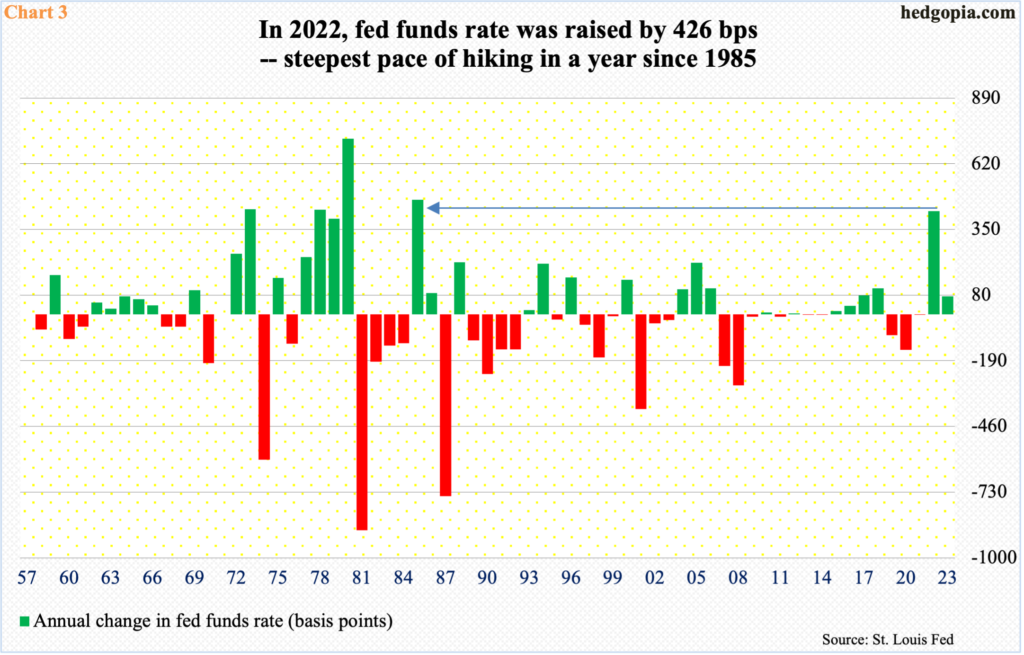
Chart 3 lays out the annual change in the fed funds rate going back to the ’50s. In 2022, it went up 426 basis points – the steepest pace of tightening since 1985.
This level of tightening is bound to adversely impact the economy. The only question is, how much of the tightening is already in the economy and how much is yet to filter through.
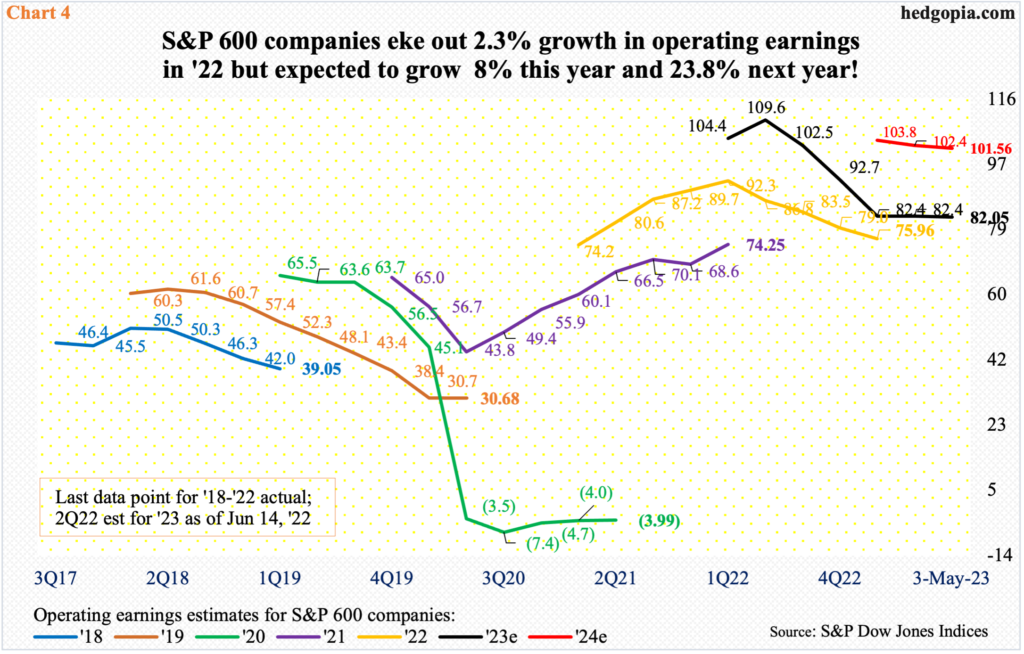
Judging by the sell-side estimates for S&P 600 operating earnings estimates, much of the damage is already done. In 2022, these companies earned $75.96, up 2.3 percent over 2021. This year, the growth rate is expected to accelerate to eight percent to $82.05 and 23.8 percent next year to $101.56.
Small-cap investors are not buying this wide-eyed optimism. If they did, the Russell 2000/S&P 600 small cap index would be a lot higher.
Indeed, sell-side analysts have a habit of being optimistic early on, bringing out the scissors as the year progresses (Chart 4). In April last year, 2022 was expected to bring home $92.70, while 2023 estimates in June last year were $111.23. Even 2024 was at $105.68 two months ago.
Small-cap investors instead are assigning a lot of weight to the message coming out of the NFIB (National Federation of Independent Business) monthly survey. In March, small-business optimism fell eight-tenths of a point month-over-month to 90.1; the all-time high of 108.8 was hit in August 2018.
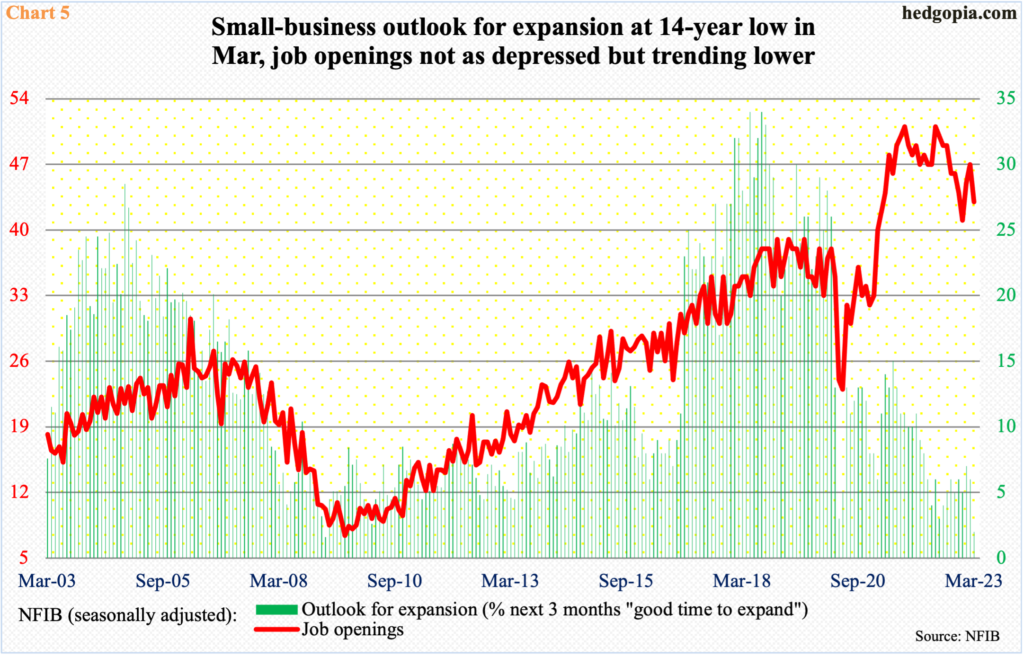
Members’ outlook for expansion is a lot worse, with March’s 2 reading the lowest since March 2009 (Chart 5). Incidentally, the bear market in stocks back then troughed in that month, with the economy ending recession three months later in June. That this metric currently is near those lows is both confusing and confidence-sapping. As well, job openings at 43 is below the record high 51 posted in September 2021/May 2022 but has not quite moved in unison with members’ outlook for expansion; there is a bit of a divergence between the two.
This only adds to confusion currently prevailing the small-cap landscape. Bears will have gained the upper hand if 1700 on the Russell 2000 decisively gives way. Bulls, on the other hand, have defended the level, but they have so far not been able to meaningfully build on this. Amidst this push-pull, they once again have an opportunity to build on last Thursday’s defense of 1700.
Thanks for reading!
