
In a week in which several tech behemoths reported their September quarter, the Nasdaq 100 is down 3.1 percent through Thursday, falling out of a descending channel. But tech bulls have dual support just underneath – Fibonacci and moving average. In all probability, this will hold for now.
Of the four tech majors reporting this week – Microsoft (MSFT), Google owner Alphabet (GOOG), Facebook owner Meta Platforms (META) and Amazon (AMZN) – MSFT had a positive reaction post-earnings on Wednesday but sold off hard on Thursday, GOOG was punished on Wednesday and then again on Thursday, while META was handed out an adverse reaction on Thursday. AMZN reported Thursday, with results having been received favorably pre-market.
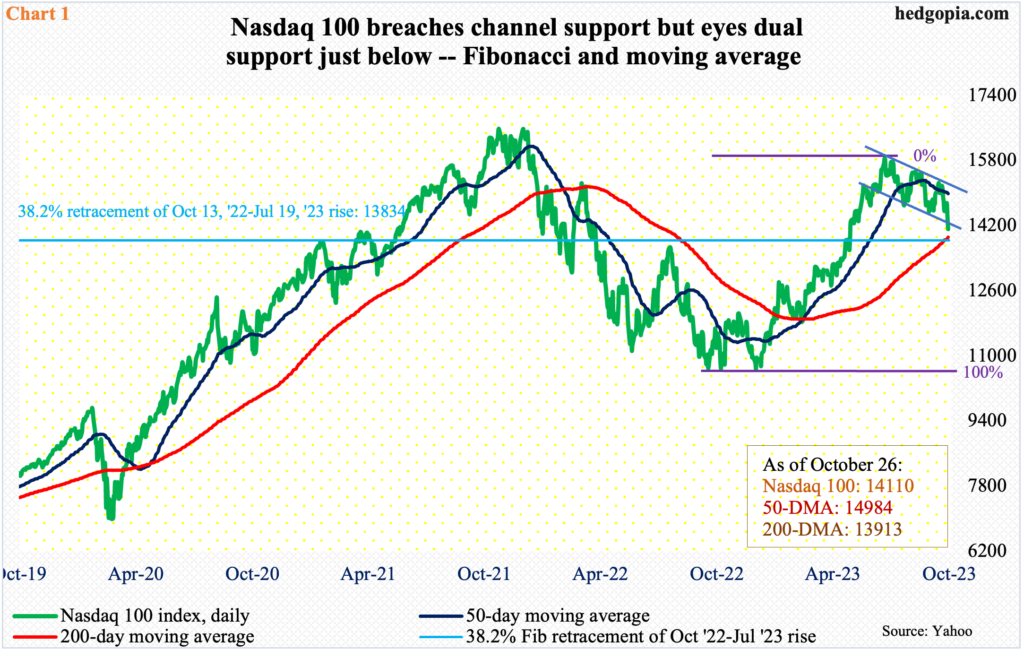
Through Thursday, the Nasdaq 100 is down 3.1 percent for the week. This will be the second consecutive down week. Last week, sellers showed up at the upper trendline of a descending channel from July 19th this year when the tech-heavy index retreated after tagging 15932. Earlier, it bottomed at 10441 last October. The ferocity of sell orders on Wednesday and Thursday has resulted in the index falling out of the channel. But odds of stability in the near term have risen due to dual support just underneath.
The Nasdaq 100 closed Thursday at 14110, with a session low of 14058. The 200-day lies at 13913. It has not closed below the average since March 10th this year. Then, there is Fibonacci support. Between last October and this July, the index surged 52.6 percent. A 38.2-percent retracement of this rally rests at 13834 (Chart 1). Given where things are, this is as good an opportunity as any for the bulls to put their foot down, and they probably will.
Concurrently, small-cap bulls, too, have an opportunity to put their down, and they have done that so far this week.
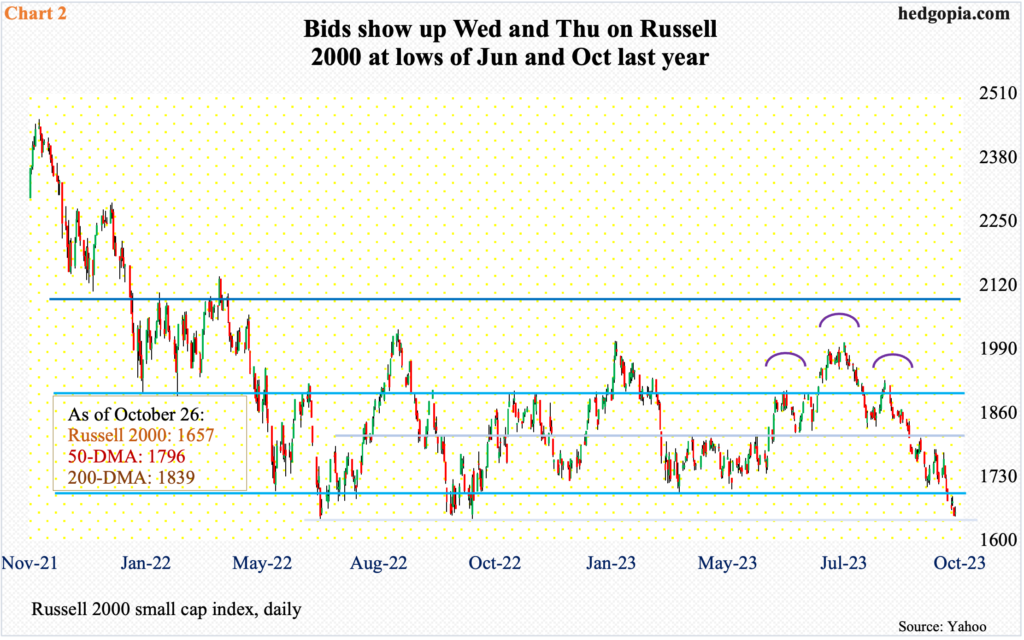
As did the Nasdaq 100, the small cap index peaked in November 2021. From that high through the June 10th low last year of 1641, it tumbled 33.2 percent. Come October (last year), that low was successfully tested. The Russell 2000 then rallied to 2004 by this July, which made up the head of a bearish head-and-shoulders pattern, the neckline of which was broken at 1800 last month; 1800 also made up the mid-point of a 21-month range between 1700 and 1900. After 1700 was breached late last week, small-cap bears were probably eyeing 1600, which is where the head-and-shoulders pattern would complete. For that to happen, they needed to also recapture the lows from June and October last year, and this is where longs are putting their foot down.
The Russell 2000 in on pace to suffer its fourth consecutive drop. The daily particularly is way oversold. Fatigue is setting in. Both Tuesday and Thursday formed a long-legged doji this week. Nearest resistance lies at 1700.
Thanks for reading!
