
With the U.S. unemployment rate at a nearly 17-year low and job growth still healthy, some divergence is popping up in jobs-related data.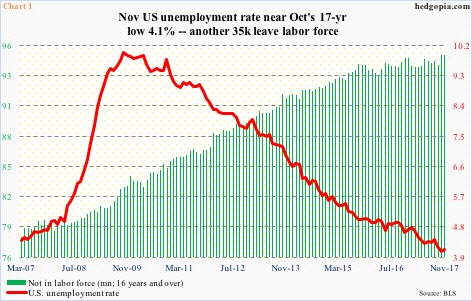
November created 228,000 non-farm jobs. With one month to go, this amounts to a monthly average of 174,000 this year. The unemployment rate in November was essentially unchanged month-over-month at 4.1 percent, which was the lowest since 4.2 percent in January 2001.
Still, there is no dearth of issues for nitpicking.
Average hourly earnings of private-sector employees rose 2.5 percent year-over-year in November. Historically, wage growth remains very subdued. The last time y/y earnings rose with a three handle was in April 2009.
The labor force continues to shrink. In November, the ‘not in labor force’ category increased 35,000 m/m to 95.4 million – a new record. The persistent contraction in the labor force helps put downward pressure on the unemployment rate (Chart 1).
Even the average monthly addition of 174,000 non-farm jobs so far this year is lower versus the monthly average of 187,000 in 2016, which itself was lower than 226,000 in 2015 and 250,000 in 2014.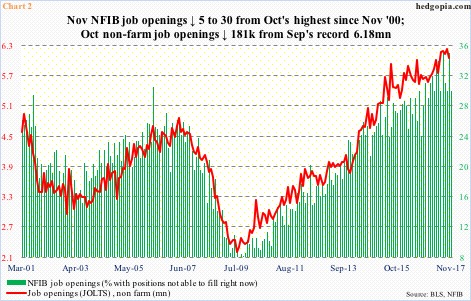
Such mixed progress is evident elsewhere.
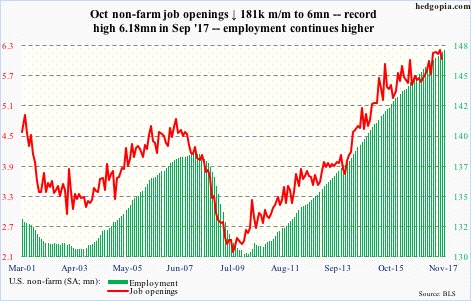
Non-farm job openings remain massive. They fell 181,000 m/m in October, but September’s 6.18 million was the highest ever. Long-term, this metric tracks very well with NFIB (National Federation of Independent Business) job openings, except there has been slight divergence of late.
In November, NFIB openings fell five points m/m to 30. Except for a reading of 35 in both July and October this year, which was the highest since 36 in November 2000, openings at small businesses have essentially gone sideways since August 2016 (Chart 2). Further, overall NFIB optimism in November surged 3.7 points m/m to a 34-year high 107.5, but job openings – although healthy – have not seen similar enthusiasm.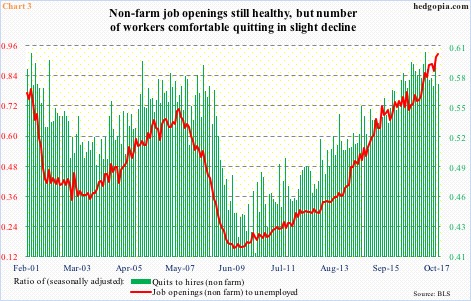
Chart 3 similarly sheds light on divergence elsewhere. It uses two ratios – quits to hires (from the JOLTS report) and job openings (JOLTS) to unemployed.
The ratio of job openings to unemployed in October came in at 0.92. Only a year ago, the red line stood at 0.72. This is the result of both the numerator increasing and the denominator dropping. The green bars, however, paint a slightly different picture.
In a healthy market, employees feel comfortable to quit as they are not worried about not finding another job. Indeed, ‘hires’ in October were 5.55 million – the highest since 5.65 million in March 2001. ‘Quits’ were unchanged m/m at 3.18 million, but they peaked at 3.21 million in May this year.
Consequently, the ratio of quits to hires peaked in April this year at 0.602, with October at 0.573. This could just be a slight deceleration, only to turn back up in due course, or it could be the beginning of something worse.
In a time like this, and particularly considering that the post-Great Recession recovery is in its ninth year, it is prudent not to brush this off right away. Once again, it may be something, or it may be nothing. In the past this cycle, similar divergence amounted to nothing. But at least remaining cognizant of the issue does not hurt.
Thanks for reading!
