
Spot gold ($1,352.10/ounce) sits at a crucial technical juncture. A breakout would send a loud and clear message.
Since bottoming at $1,045.40 in December 2015 through last week’s high of $1,365.40, gold quietly rallied nearly 31 percent. Stocks did better during the period, with the S&P 500 large cap index rallying 44 percent.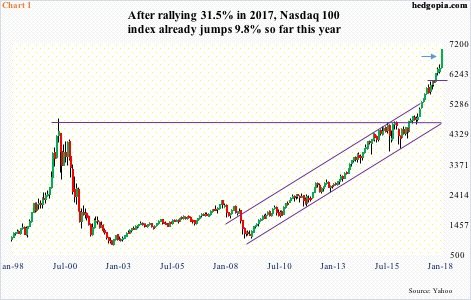
But the fact that a risk-off asset like gold would rally as much as it did in a risk-on environment probably contains a message, which is that not all are buying the hunky-dory message equities are telegraphing.
The S&P 500 rallied 19 percent in the past five months, and 7.5 percent this year alone. The Nasdaq 100 is already up nearly 10 percent this year, and January is not even over yet. Just look at that filled green candle (arrow in Chart 1). The index has gone parabolic particularly since January last year.
These are off-the-chart numbers. Time will tell, but we could very well be witnessing events before a blow-off top. In the event of a risk-off environment, gold can attract more bids. Gold bugs could use one.
The yellow metal is at a crucial juncture technically.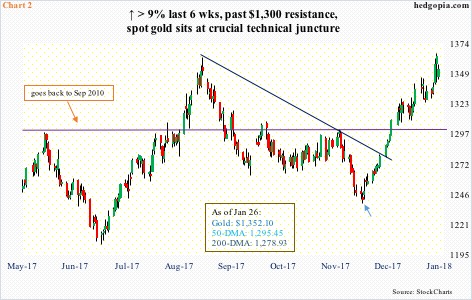
In the last six weeks (blue arrow in Chart 2), gold has gone straight up – rallying north of nine percent. In the process, it retook both 50- and 200-day moving averages. Shorter-term averages – 10- and 20-day – are sharply rising, with the former providing support for nearly three weeks now.
The prevailing momentum has been accompanied by flows. Since that December 12th low in gold through last Thursday, GLD (SPDR gold ETF) took in $311 million and IAU (iShares gold trust) $597 million (courtesy of ETF.com).
Gold rallied 1.4 percent last week, breaking out intraday Thursday of a slightly falling trend line from August 2013 (Chart 4/5). Ahead of this, GLD in particular was already attracting funds, having taken in $874 million in the four sessions through last Tuesday.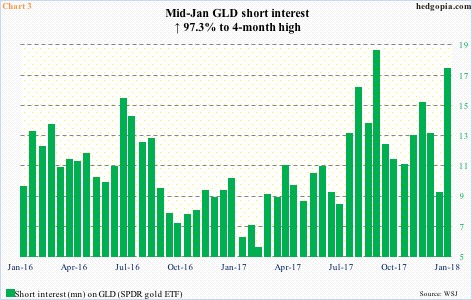
Short squeeze likely contributed to gold’s recent advance as well.
Short interest on GLD during the January 1-12 period shot up 97.3 percent period-over-period to 17.2 million shares. This was a four-month high (Chart 3). Since the 12th this month through last Thursday’s high, gold rallied 2.2 percent.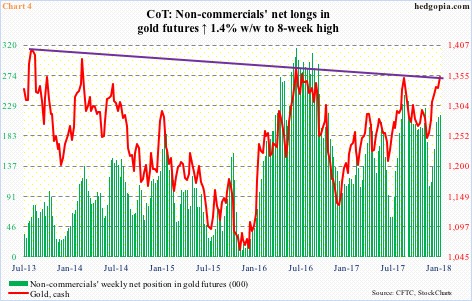
Add to this non-commercials’ accumulation of net longs in gold futures.
In the week ended December 12th, these traders’ holdings bottomed at 107,068 contracts. By Tuesday last week, they held 214,684 (Chart 4). The pace of growth has slowed in the past three weeks, but as recently as mid-September last year they held 254,760 when the cash was a similar level.
While non-commercials’ less aggression now versus four months ago can be perceived as a slight negative, the fact remains that the price is at a comparable level as there is buying pressure from other sources. Plus, it probably also suggests that the green bars in the chart have room to rise.
Once again, gold bugs could use one.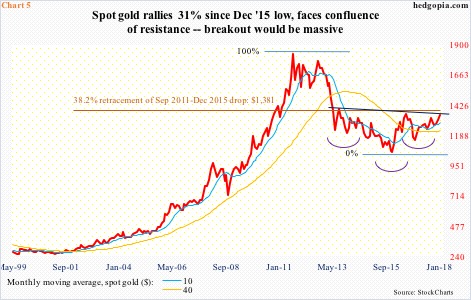
Right now, the metal seems to be benefiting from ‘all the wheels in motion’ phenomenon. This naturally has consumed a lot of energy. Is there more left in the tank? The bulls hope so, as the metal is sitting at a crucial juncture.
There is a lot to digest in Chart 5. It may even look confusing at first glance. That is because where gold sits today there is a confluence of resistance.
As mentioned above, gold last Thursday broke out of a trend line from August 2013 intraday but closed out the week right on it (dark blue line). This also approximates the neckline of a reverse-head-and-shoulders formation (violet arcs). Then there is Fibonacci resistance (pink line).
Gold peaked in September 2011 at $1,923.70, then bottoming at the aforementioned $1,045.40 in December 2015. A 38.2-percent retracement of this decline lies at $1,380.91.
Last Thursday, gold rose to $1,365.40 intraday. Importantly, this Fibonacci resistance has already been tested twice – unsuccessfully – once in July 2016 when the metal rallied to $1,377.50 and the other last September when it rose to $1,362.40. The third time is the charm? We will see. This time around, the 10-month average is rising, and the 40-month flattish to slightly rising.
The next several sessions will be crucial in this regard. If fatigue sets in and shorter-term averages begin to go flat/roll over, the downside risk lies at $1,300, which, as things stand, likely holds, at least at the first try. In this scenario, there might even be a trade using options to either earn some premium or go long near that support. Wait and watch for now.
In the meantime, existing GLD ($128,05) longs who are sitting on nice profits can think about doing weekly covered calls. February 2nd 129 calls bring in $0.51. Last week, the ETF retreated after hitting $129.51. If called away, longs would have gotten out at that exact price. Else, the premium is kept.
Thanks for reading!
