U.S. equity bulls supposedly got the green signal from the January effect, which postulates that as goes January so goes the year.
The S&P 500 large cap index was up a strong 5.6 percent in the first month of the year. Some others such as the Nasdaq 100 rallied even more – up 8.7 percent.
That said, small-caps partied less. The Russell 2000 small cap index only rose 2.6 percent in January.
In the markets, the January effect is just one of those several adages that catch traders’ fancy.
There is sell in May and go away. There is the Santa Claus rally. There is even a Super Bowl indicator.
It would be imprudent to simply hang one’s hat on any one of these indicators and position investments accordingly. Nothing is fail-safe. Records are meant to be broken.
Nonetheless, the January effect does have a good track record. Will it work this year?
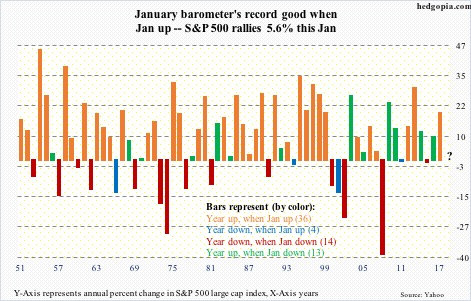
The attached chart plots year-over-year change in the S&P 500 going back to 1951. Through 2017, there are 67 data points. The color-coded bars have been divided into four groups: (1) years that were up when January was up, (2) years that were down when January was up, (3) years that were down when January was down, and (4) years that were up when January was down. In parenthesis is the number of years for each group.
Of the 67, there have been 36 years in which both the year and January were up. This includes last year. In 2017, the S&P 500 jumped 19.4 percent, and this was preceded by a January that was up 1.8 percent.
Importantly, the signal is clearly strong when January is up. Of the 67 years, January was up in 40. Of this, there have only been four years in which the year ended down with January up (blue bars). Of the years in which January is up, 90 percent of the time the year ends up in the green. Orange bars jump out in the chart.
Hence the reason why the bulls get excited when January starts off in the green. This year, they only wish small-caps participated with a little bit more vigor.
Thanks for reading!

