- 3Q14 GDP numbers revive – once again – hopes of surge in business capX
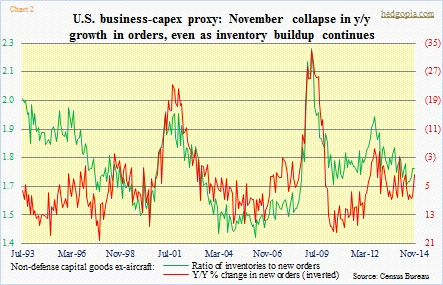
- Collapse in November y/y growth in orders for non-defense capital goods ex-aircraft
- With energy accounting for nearly 1/3rd of S&P 500 capX, capX bulls will have to wait a while longer
When the final GDP estimate for the third quarter was reported last Tuesday, it was trumpeted as if the long-awaited escape velocity had finally arrived. It was indeed a great report. The five-percent print (real) was the highest in 11 years. Growth in business investment in particular was revised higher to an 8.9 percent pace from a previous estimate of 7.1 percent. And that is what excited people.
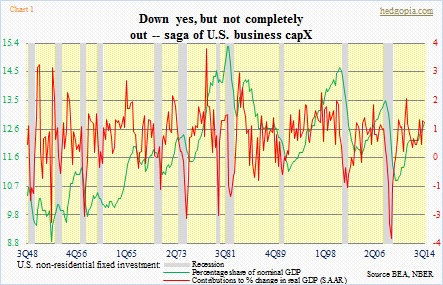
This recovery has been characterized by hesitancy on the part of businesses when it comes to adding to capital and labor. That green line in Chart 1 (representing the share of non-residential fixed investment in nominal GDP) has consistently made lower highs since the early 80s. Since 2010 it has been moving higher, to 12.8 percent in 3Q14. But it is still below the most recent high of 13.5 percent in 1Q08. So when 3Q14 numbers came out, escape-velocity hopes were rekindled. Once again!
Two things need consideration.
First, are we not setting ourselves for disappointment by expecting a surge in business capital expenditures? Because if businesses opened up their purse the way they did in days leading up to the 2001 and 2008/2009 recessions, all they would do is borrow from the future. That is precisely what happened back then. You invest too much, expecting end-demand to materialize. The latter does not show up, and you have to abruptly pull in your spending horns.
This leads to the second point. How reliable is the 3Q14 uptick in business capX? Let us look at another data series and try to find out what is going on. The day the GDP number was released also came the durable-goods data for November – most recent data we can lay our hands on.
And it is not good. Chart 2 plots inventories and orders for non-defense capital goods ex-aircraft – a proxy for business capX. Shipments have flat-lined for five months. More worrisome is the trend in orders. Year-over-growth collapsed to below two percent from nearly eight percent in October. And the trend probably continues. Beginning November last year, spending picked up, and now the bar is higher for y/y growth. Inventories are the same way. The inventories-to-orders ratio started dropping two years ago, made a trough in June, and has been trending higher since.
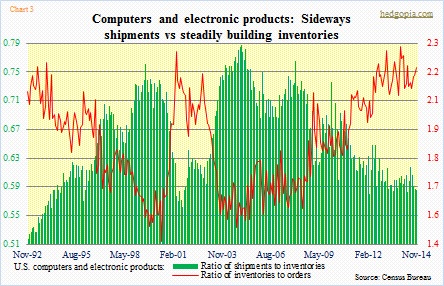
We can also look into how things are in computers and electronics products (Chart 3). Not much relief here as well. Shipments are flat to slightly down. Inventories are trending higher. And orders are flat to slightly down. After having troughed in August, the ratio of inventories to orders is in an uptrend, even as the ratio of shipments to inventories is slightly trending down. By the way, this captures Black Friday sales of electronics goods. Not much to write home about.
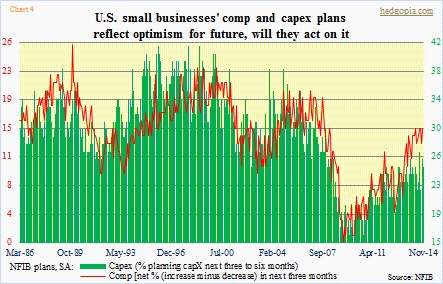
The irony is, the memories of the last two expansions are all too fresh on most people’s minds. Things were good back then. The reason why they keep hoping that those days would come back. Everybody expects a pickup in capex, but does not want to be the first to do so. Who will bell the cat? Respondents to National Federation of Independent Business surveys are nowhere near as optimistic as have been in past cycles (Chart 4).
And then we throw the new energy dynamics in the mix, there is nothing left to be hopeful about a surge in business capX next year. Among the S&P 500 companies, energy accounts for nearly one-third of capX. With crude oil having been cut in half in the last six months, the debate is not about if/when the sector’s capX plans take a hit rather by how much.
CapX bulls will have to wait a while longer.

