Here is a brief review of period-over-period change in short interest in the January 16-31 period in 10 S&P 500 sectors.
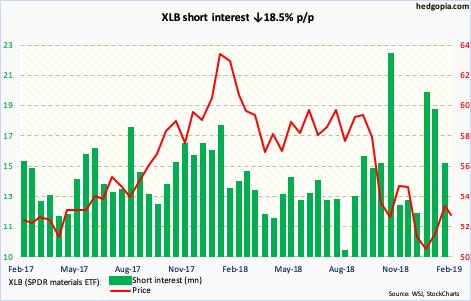
Shorts continued to cut back in the second half of January, as XLB (52.78) kept rallying. Intraday between December 26 and January 30, the ETF jumped 16 percent. Since that high, it has slightly come under pressure, with a successful test last Friday of the 50-day moving average (52.08). Near term, resistance lies at 54.50s. Medium term, conditions are extended.
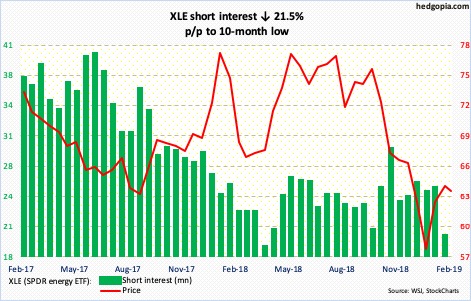
From Boxing Day through February 1 intraday, XLE (63.24) rallied 22.3 percent. Short interest is at a 10-month low. Sellers showed up seven sessions ago at 64-65 resistance. At the same time, bulls defended the 50-day last Friday. With potential fuel for squeeze receding, bulls have their work cut out, particularly medium term.
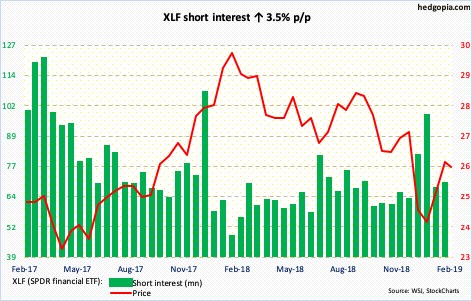
Last December, XLF (25.75) bulls lost major support at just north of 25, which they recaptured in January. Most recently, this support was defended last Friday. This back-and-forth likely continues near term. Medium term, bears likely have the upper hand. For the past three weeks, sellers consistently showed up at 26. The weekly remains overbought.
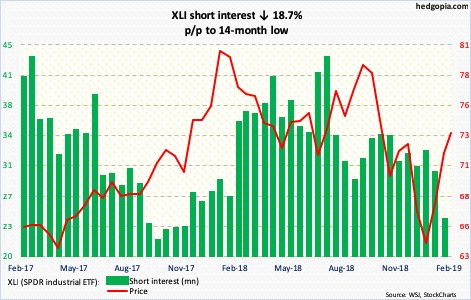
XLI (73.46) short interest decreased 25 percent in January. The rally that began on December 26 pushed the ETF past both the 50- and 200-day. It is currently right above the latter (73.08). Shorter-term moving averages are getting defended. The daily in particular is grossly overbought, but it has been that way for a while. As long as bulls defend the 200-day, the status quo continues.
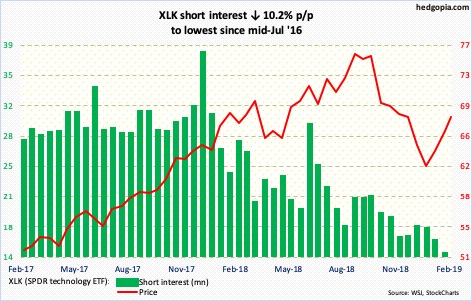
XLK (67.96) shorts continue to turn tail. The ETF rallied in the last seven weeks, with shorts lending a hand. This also means that potential fuel for short squeeze is lacking. That said, momentum is intact, with subtle signs of distribution. In the event of weakness ahead, there is decent support at 64.50s.
XLP (SPDR consumer staples ETF)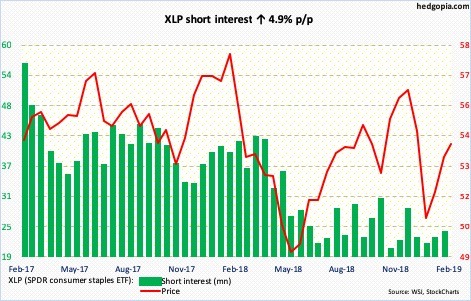
After breaking out of the 200-day on January 31, XLP (53.93) has gone sideways to slightly up. This preceded defense in the last two months of the neckline of a potential head-and-shoulders pattern. Daily conditions are deeply overbought, but the ETF has room for continued strength on the weekly. The 200-day therefore is the line in the sand.
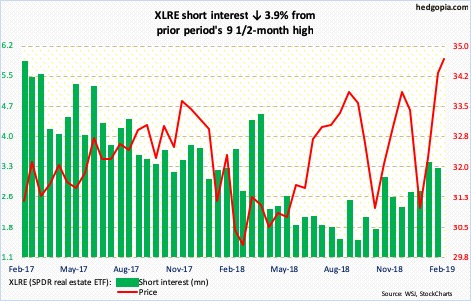
XLRE (34.67) short interest has trended higher since end-September last year. The ETF has had a phenomenal rally since bottoming on December 26. Shorts are staying put. They will probably reconsider their thesis should XLRE break out of just south of 35. It has traded within a rectangle since July 2016. It is currently right at the upper bound.
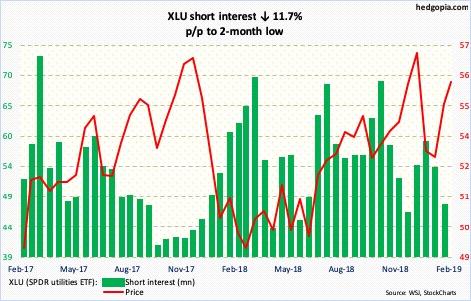
Bulls managed to push XLU (55.66) past resistance at 54.50-55. For the past several sessions, it has rallied all along the daily upper Bollinger band. The daily is in deep overbought territory, with Monday producing a long-legged doji. Should unwinding begin, it will be interesting to see what transpires at the 50-day (54.17).
XLV (89.83) shorts have been adding. This aggression did not pay off in January. The ETF has pulled back a tad since hitting 91.15 near the daily upper Bollinger band five sessions ago. The daily MACD is on the verge of a potentially bearish cross-under. For this scenario to pan out, the 50- and 200-day (88.73 and 88.52, in that order) need to break.
XLY (SPDR consumer discretionary ETF)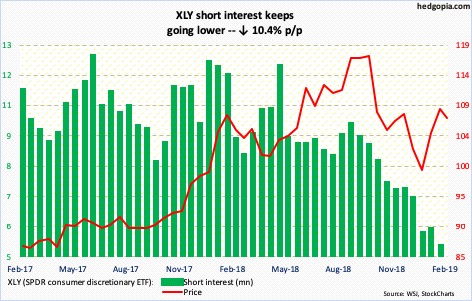
Yet another fortnight, and yet another low in XLV (107.32) short interest. Although it is possible odds favor the remaining shorts at least in the near term. In the past several sessions, bulls retook the 200-day, but barely, and were unable to stay above. The 50-day rests at 103.83. If it is lost, there is decent support at 101-102.
Thanks for reading!

