On Inauguration Day, US stocks pushed further into record territory. Concurrently, several indicators already find themselves in uncharted territory. The ongoing earnings season can decide if already-extended further extends into extended territory or unwinding begins.

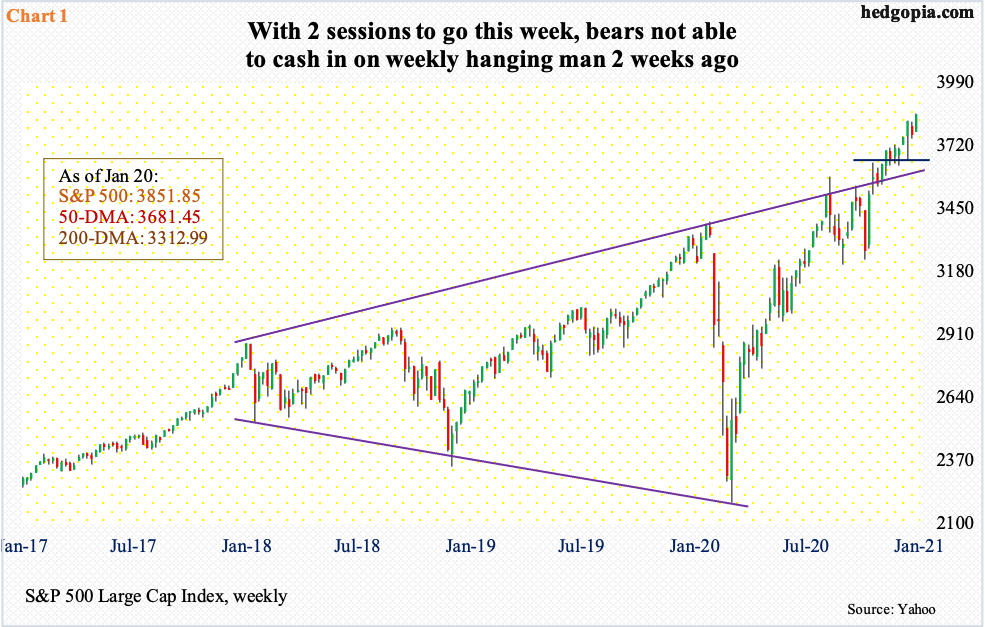
US stocks welcomed the Joe Biden presidency by posting new record highs. Large-, mid- and small-caps all made new intraday highs on Wednesday; the S&P 500 Large Cap Index rallied 1.4 percent to 3851.85, with a new intraday high of 3859.75 – past the prior of 3826.69 from the 8th (this month).
With this, bulls have carved out new short-term support at 3820s. Only 11 sessions ago, on the 4th, crucial support at 3640s was defended, with an intraday low of 3662.71. In December, 3640s was defended twice. This level has memory attached to it as on November 9 when Pfizer (PFE) announced its positive vaccine news bulls aggressively bought the index but only to close 95 points lower from the intraday high of 3645.99. As long as this level is intact, they deserve the benefit of the doubt.
With two sessions to go this week, once again, bears seem unable to cash in on a potentially bearish formation. Two weeks ago, a hanging man formed on the weekly (Chart 1), but this pattern needs confirmation.

Equity bulls could not be happier how the year has gotten off. There are still six trading sessions left before the month is out, so things can always change. Thus far, the S&P 500 is up 2.6 percent. As overbought as the technicals are, bears have not had any traction. From their perspective, the risk is that overbought stays overbought longer than expected.
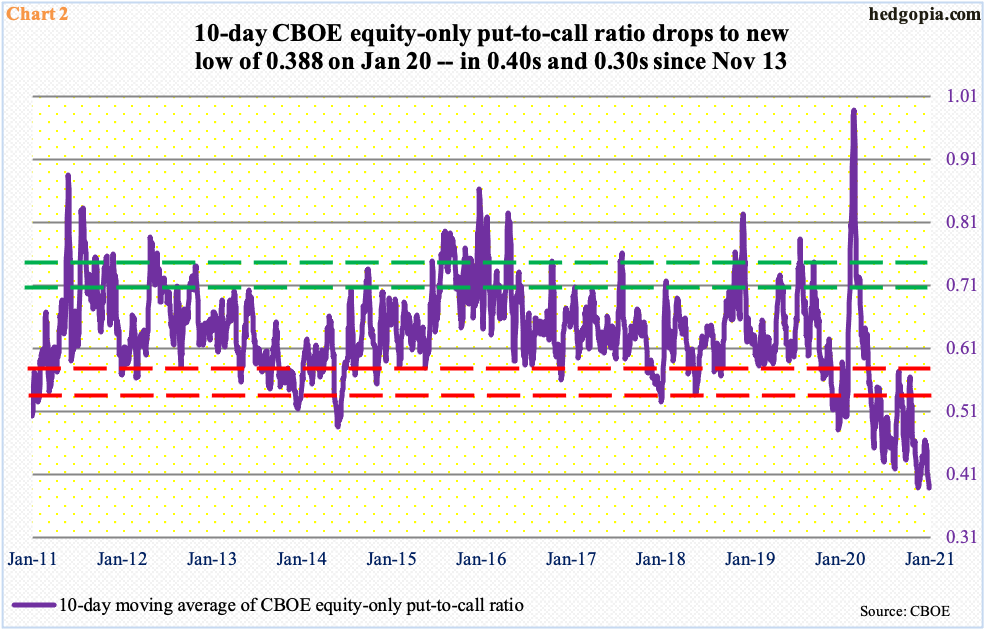
Take a look at Chart 2. It tallies the 10-day moving average of the CBOE equity-only put-to-call ratio. It made a new low of 0.388 on Wednesday. Ironically, if the metric followed how it behaved mostly in the past, the ratio would have begun to unwind from the low-0.50s. This time around, it just kept going lower – further and further into uncharted territory. Since November 13, the 10-day average has been in the 0.40s or lower, with seven of them in the 0.30s.
Post-vaccine news – PFE’s on November 9 and Moderna’s (MRNA) a week after that – there has been a sea change in investor optimism, with heavy reliance on long calls, which have paid off big time, unleashing a self-fulfilling prophecy.

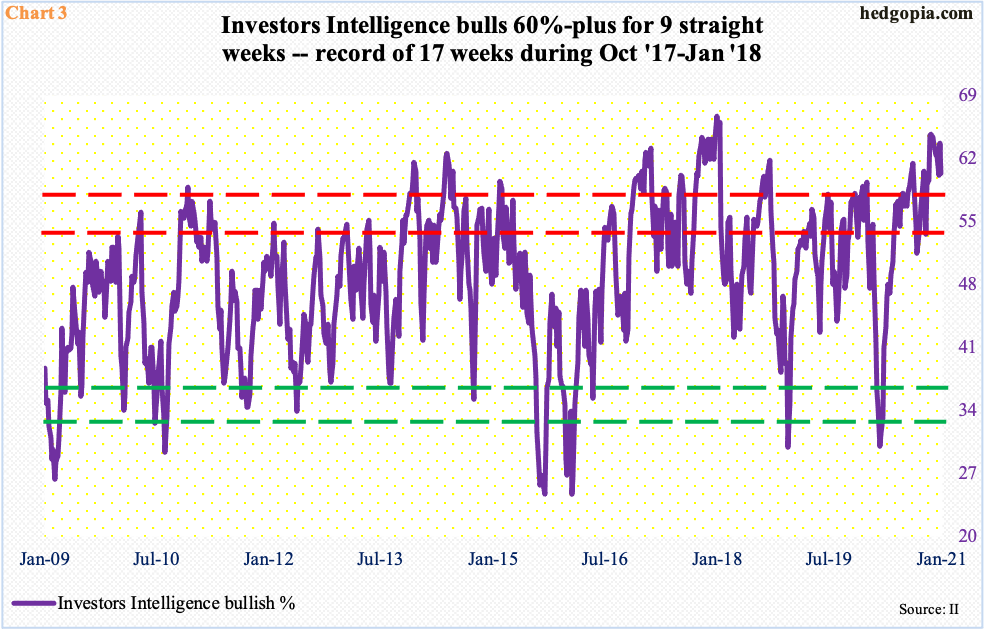
Once again, going back to the theme of bullish sentiment shifting into higher gear post-vaccine news, on the week to November 3 – the presidential election day – Investors Intelligence bulls were 53.6 percent. In the subsequent week, it rose to 59.2 percent (PFE announcement) and to 59.6 percent (MRNA announcement) a week after that. Then in the week to November 24, it shot up five percentage points to 64.6 percent (Chart 3). Another eight weeks have gone by, and bulls remain north of 60 percent, with this week at 60.4 percent, down 3.3 percentage points week-over-week.
Historically, it has proven difficult to sustain north of 60 percent. There are exceptions, of course. The current nine-week stretch is already the second longest after record 17 consecutive weeks of 60 percent or higher Between October 2017 and January 2018. Is this metric headed into uncharted territory as well? Time will tell.

Along with the aforementioned put-to-call ratio, several others have gone on to defy gravity in recent months – including foreigners’ net purchases of US equities (chart here) and FINRA margin debt (chart here).
As things stand, it is possible bulls are looking toward the ongoing earnings season to push further into uncharted territory.
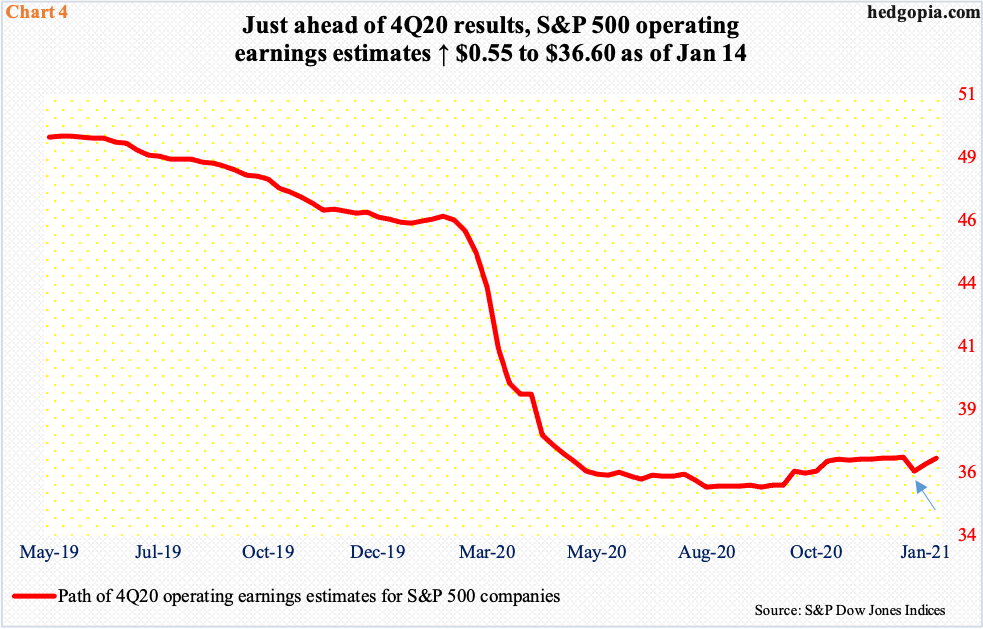
The 4Q20 earnings season began in earnest last Friday when several leading financials such as JP Morgan (JPM), Wells Fargo (WFC) and Citibank (C) reported their December quarter. A day prior – as of last Thursday – operating earnings estimates for S&P 500 companies were revised up $0.26 to $36.60. As a matter of fact, estimates bottomed as 2020 closed, at $36.05 (arrow in Chart 4). Arguably, this reflects sell-side conviction that the worst is behind. The only question is if markets anticipated this and is thus in the price. In fact, these stocks sold off post-earnings. But there is a whole host of tech companies yet to report, and that will decide if investor sentiment extends further into extended territory or begins to unwind.
Thanks for reading!

