
As the FOMC winds up its two-day meeting today, one cannot help but think of the Fed put that has led investors to take on risk and go up the risk curve, driving one after another metric into uncharted territory.
On Tuesday, as the FOMC began a two-day meeting, the S&P Case-Shiller Home Price Index published its report for November. Nationally, home prices shot up 9.5 percent year-over-year in that month. This was the fastest y/y pace since February 2014. Prices have been accelerating since bottoming at 3.1 percent in August 2019 and particularly since bottoming at 4.3 percent last June.
The Fed currently buys $120 billion/month in mortgage-backed securities and treasury notes and bonds. Last March, it held $4.2 trillion in assets, versus $7.4 trillion now. The 30-year fixed mortgage rate has been under three percent for six months now.
Home sales have been very strong, and inventory is tight. The result is persistently rising prices. The Fed probably deserves kudos for strong housing numbers as its purchases of the aforementioned bonds has put a lid on rates.
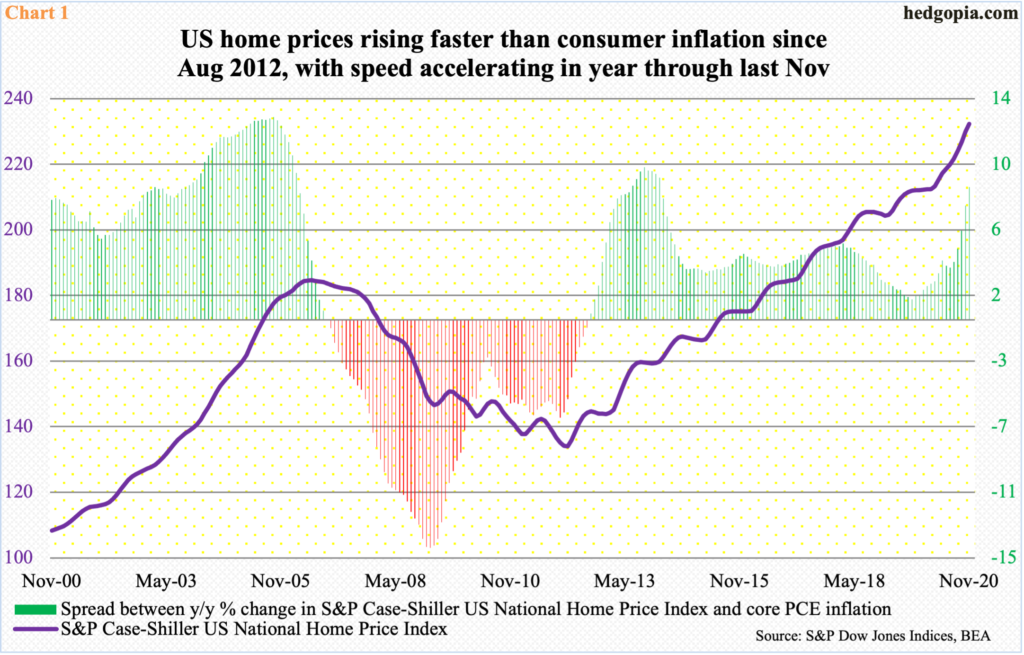
But there is another aspect to this as well. This is also inflationary. Chart 1 plots the difference between the y/y change in home prices and core PCE inflation, which is the Fed’s favorite measure of consumer inflation.
In the 12 months to November, core PCE (personal consumption expenditures) rose 1.38 percent. The last time it grew with a two handle was in December 2018. As far as this metric goes, there is no inflation in the system. Concurrently, home-price appreciation has exceeded consumer inflation since August 2012 (Chart 1). If prices are rising at eight or nine percent a year, a homebuyer may have to reduce expenses elsewhere, because his income will not be keeping up with this, not particularly if wages are indexed to consumer inflation.
So, it is an important variable. But the Fed in all probability is not looking at the issue this way, rather from the viewpoint of wealth effect.
Rising home prices do indeed boost the morale of consumers.
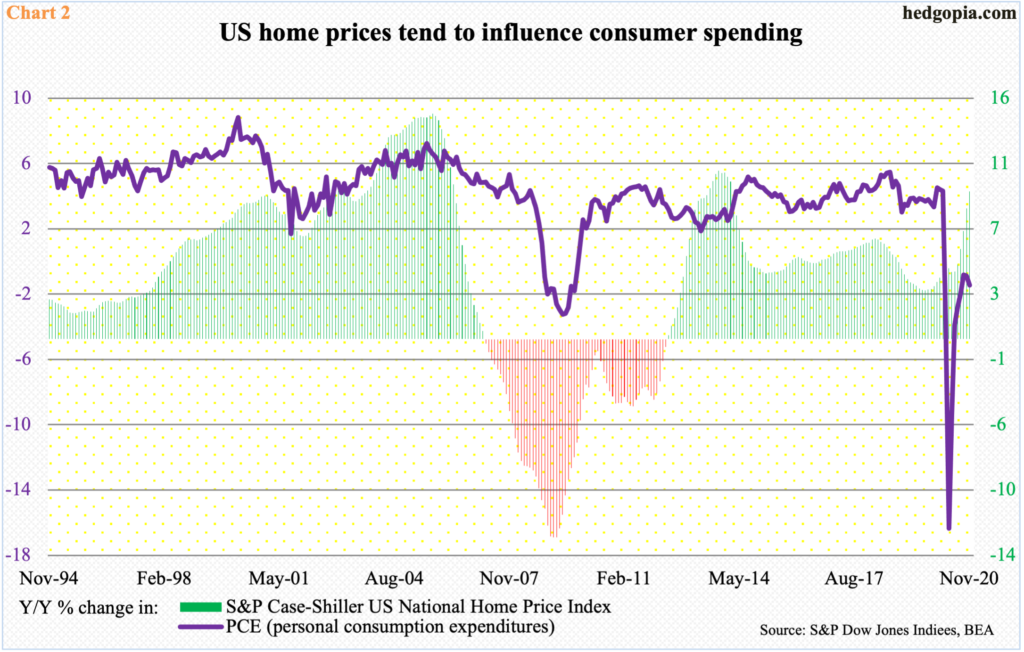
The sharp y/y drop in PCE in Chart 2 is due to Covid-19 disruptions, so it is an aberration. Last April, PCE collapsed 16.1 percent y/y to a seasonally adjusted annual rate of $12.1 trillion, which was the lowest total since February 2015. It has since recovered to $14.6 trillion in November, but on a y/y basis growth has been negative for nine straight months through November. This was a time when home prices were galloping ahead. Viewed this way, the two have diverged, but longer term they maintain a tight relationship.
Hence, strictly from the wealth effect perspective, consumer spending gets a tailwind from rising home prices – the same way it does with rising stock prices.
Going back to the Alan Greenspan era, which began in 1987, the Fed has been paying attention to stock prices. After Ben Bernanke and Janet Yellen, Jerome Powell, the current chair, has stuck to this.
On March 23, as the economy shut down due to Covid-19, the Fed announced unlimited QE. Until then, US stocks came under immense pressure in February and March. Then they responded to the monetary morphine, bottoming on that exact date. From the intraday low in that session through Tuesday’s fresh high, the S&P 500 Large Cap Index is up nearly 77 percent, the Nasdaq 100 100 percent and the Russell 2000 Small Cap Index 127 percent.
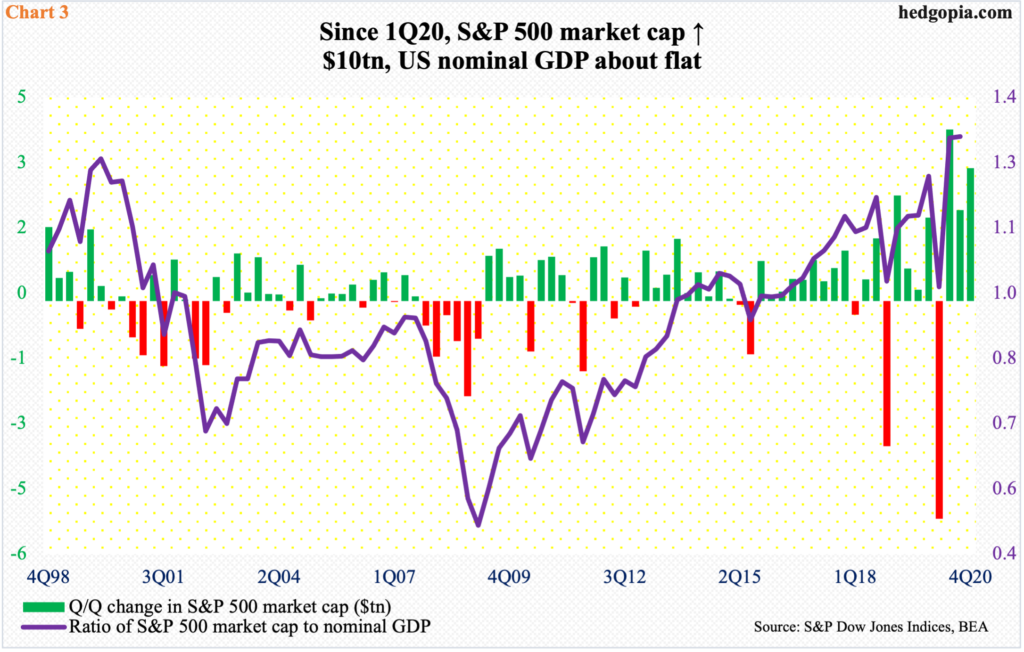
Consequently, the S&P 500 market cap went up by nearly $10 trillion in the last three quarters of last year – by $4.2 trillion, $2.2 trillion and $3.3 trillion, in that order (Chart 3). Nominal GDP is essentially flat. The ratio between the two was 1.32 in 3Q20, up from 0.99 in 1Q20.
For a marginal buyer of, let us say, the S&P 500, it is progressively costing more – a cynic might say inflation – but for those who are holding, wealth is accumulating. And the paper profit they are sitting on might just lead them to go out and spend a little bit more. Hence the wealth effect and hence central bankers’ penchant for this.
The so-called Fed put leads investors to take on risk and go up the risk curve. That is the whole idea in the first place. We are seeing it in data. Margin debt reached a fresh high in December (chart here), investor sentiment is lopsidedly bullish (more on this here), foreigners are sitting on record purchases of US equities (chart here), not to mention the amount of call option that is being traded currently.
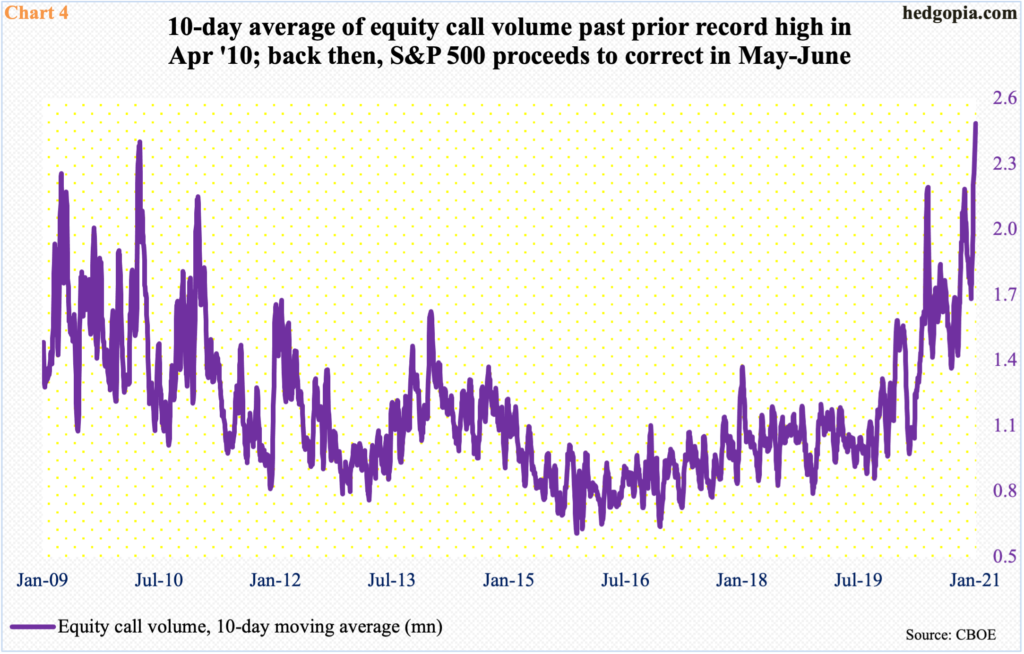
Using a 10-day moving average, equity call volume surged to 2.44 million on Tuesday – well past the prior high from April 2010 (Chart 4). For whatever it is worth, back then, the S&P 500 went on to correct in May and June that year. Things may or may not pan out similarly this time around. The Fed put has let the animal-spirits genie out of the bottle. Only a Paul Volcker type can dare to even think about putting it back in.
Thanks for reading!
