Household formation has picked up speed, as have sales of homes, putting downward pressure on the supply of homes and upward pressure on prices. Prices are appreciating seven-eight times the rate of consumer inflation, hence not sustainable.

US households are growing nicely, ending March at 126 million, up from 125 million in March last year. Last August’s 127.3 million was a record, with formation just under 126 million for four months.
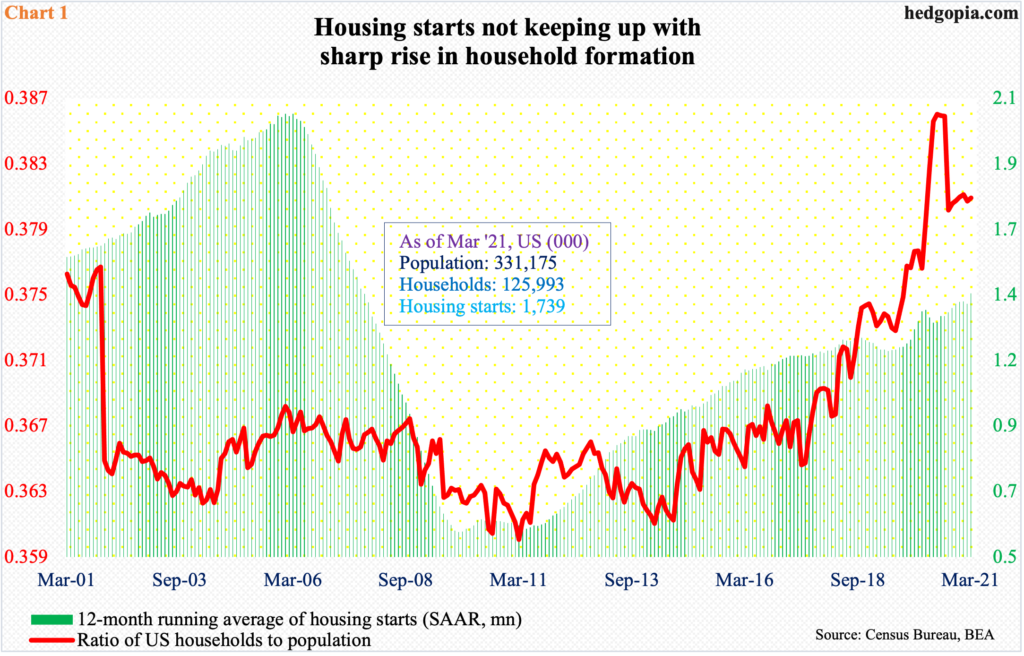
On a 12-month running average basis, households hit a new high of 126.3 million in March, up 2.9 million from March last year. The momentum in household formation can be seen by comparing it to population growth. The ratio between the two jumped to 0.386 last June, before retreating slightly; since last September, it has gone sideways at 0.38 (Chart 1).
Housing starts, in contrast, are struggling to keep up. In March, they grew 19.4 percent month-over-month to a seasonally adjusted annual rate of 1.74 million units. Last April, post-pandemic, they dropped as low as 934,000 units.
In recent months, builders are showing aggression in breaking new ground. In March, the 12-month running average stood at 1.43 million, up from 1.37 million a year ago.

Builders are beginning to get their act together as sales have picked up momentum.
In March, new home sales jumped 20.7 percent m/m to 1.02 million (SAAR), which was the highest since August 2006, while sales of existing homes dropped 3.7 percent m/m to 6.01 million. Last October, existing home sales rose as high as 6.73 million.
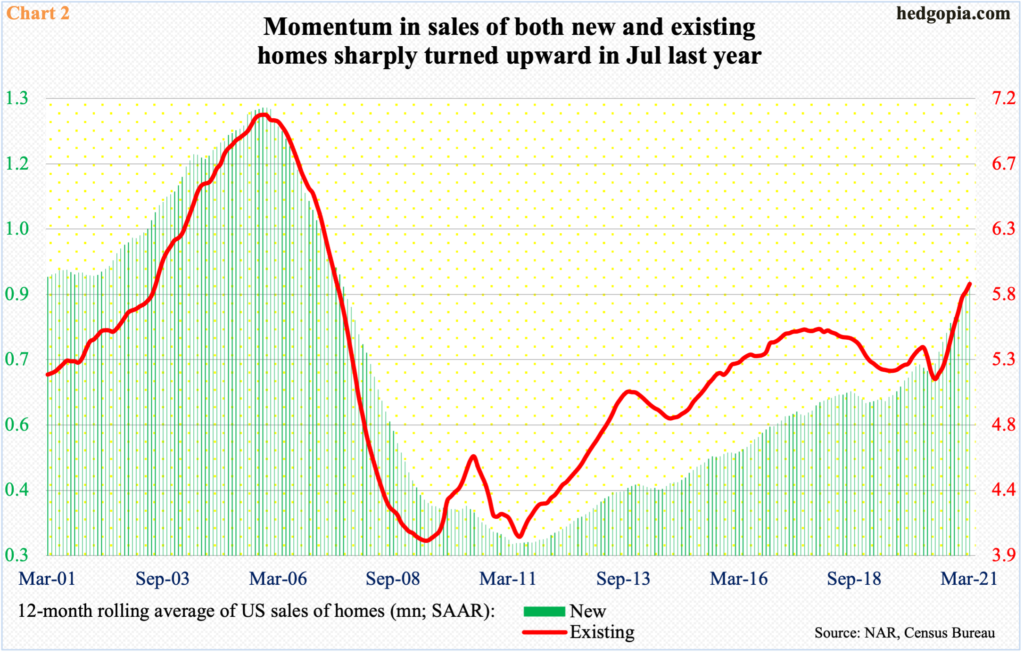
The momentum in sales is better seen in Chart 2, which uses a 12-month rolling average. Sales turned sharply upward last July. On this basis in March, new homes were 890,000 and existing homes 5.86 million – the highest since July 2007 and June that year, in that order.

A lack of starts and a pickup in sales have combined to shrink the availability of homes to a bare minimum.
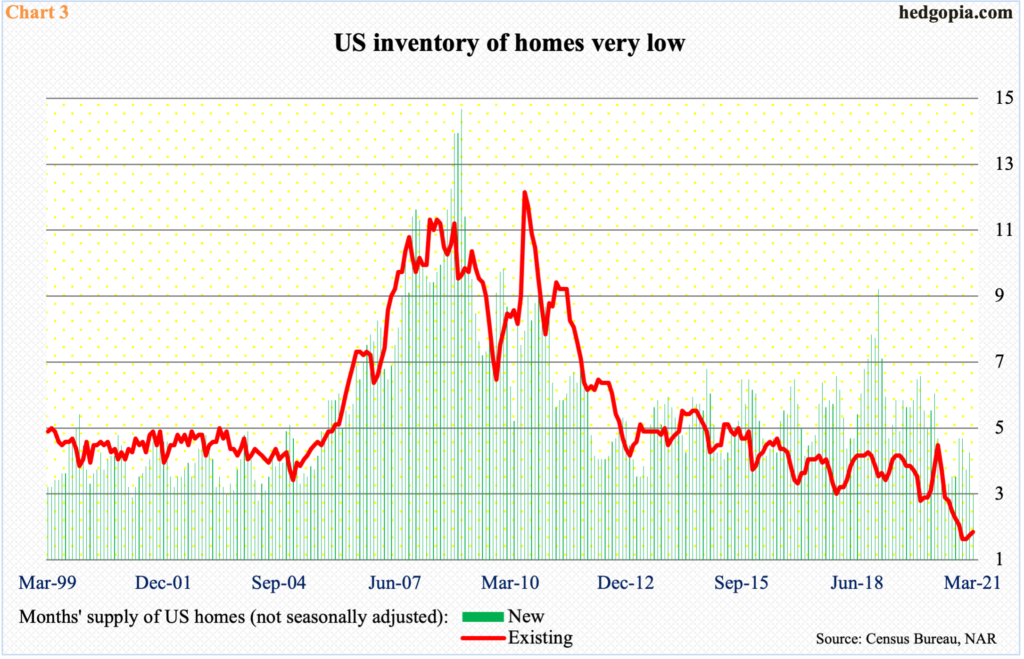
In March, the supply of existing and new homes respectively stood at 2.1 months and 3.2 months – not too far away from their respective record lows (Chart 3). At the peak in 2009-2010, supply soared to low- to mid-double digits. Even in the early months last year, as the economy shut down and sales took a hit, supply rose to 4.6 months and 6.1 months in May and April respectively. In the subsequent months, the metric persistently came under pressure.

One aftermath of all this is the massive upward pressure on prices.
In March, the median price of an existing home increased 17.2 percent year-over-year to $329,100 – a new record – while that of a new home edged up 0.8 percent to $330,800, with the latter reaching a record high $365,300 last December.
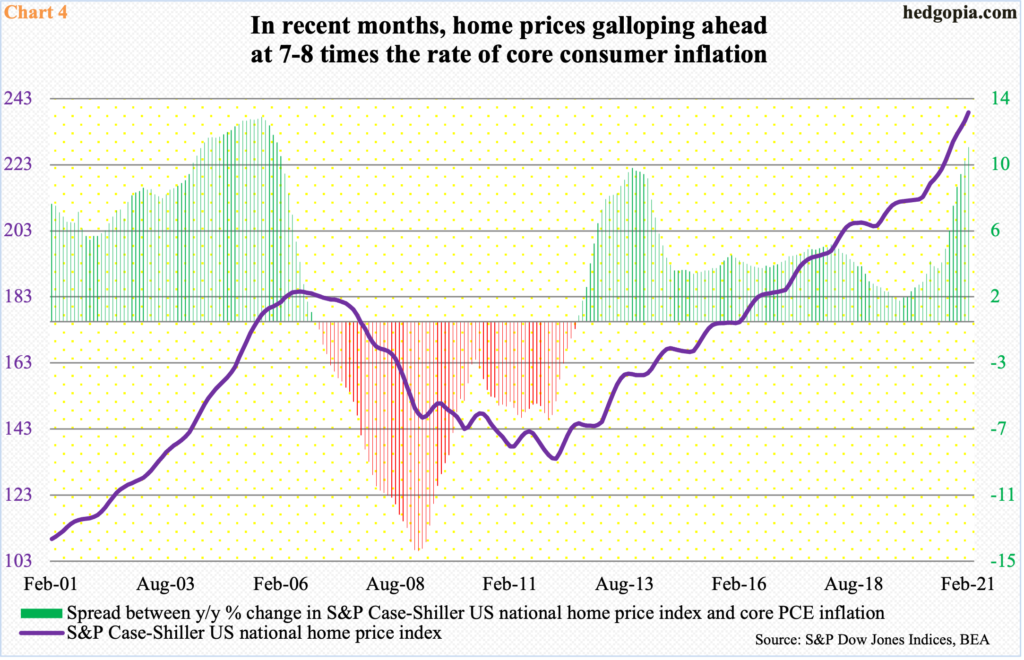
The S&P Case-Shiller National Home Price Index comes with a little lag, so we only have February’s data. Prices jumped 12 percent y/y in that month. This was a pace not seen since February 2006 and is several times that of consumer inflation.
In the 12 months to February, core PCE, which is the Fed’s favorite measure of consumer inflation, increased at a 1.41 percent rate. The last time inflation rose with a two handle was in December 2018.
As a result, the spread between the rate prices of homes and consumer items in general are inflating keeps widening. In February, the gap between the two was 10.6 percentage points – the widest since January 2006. At the peak in September 2005, the spread was 12.4 percentage points (Chart 4). This was around the time sales were about to roll over (Chart 2).
It is too soon to say if sales have peaked. But the current pace of price appreciation should increasingly act as a headwind. The gap between home price appreciation and consumer inflation is simply too wide, hence not sustainable. In due course, either the latter shifts upward or the former downward.
Thanks for reading!

