
Through 4Q24, buybacks continued to act as a tailwind, while margin debt fell in February from January’s fresh record. The latter in particular is at risk of continued downward pressure.
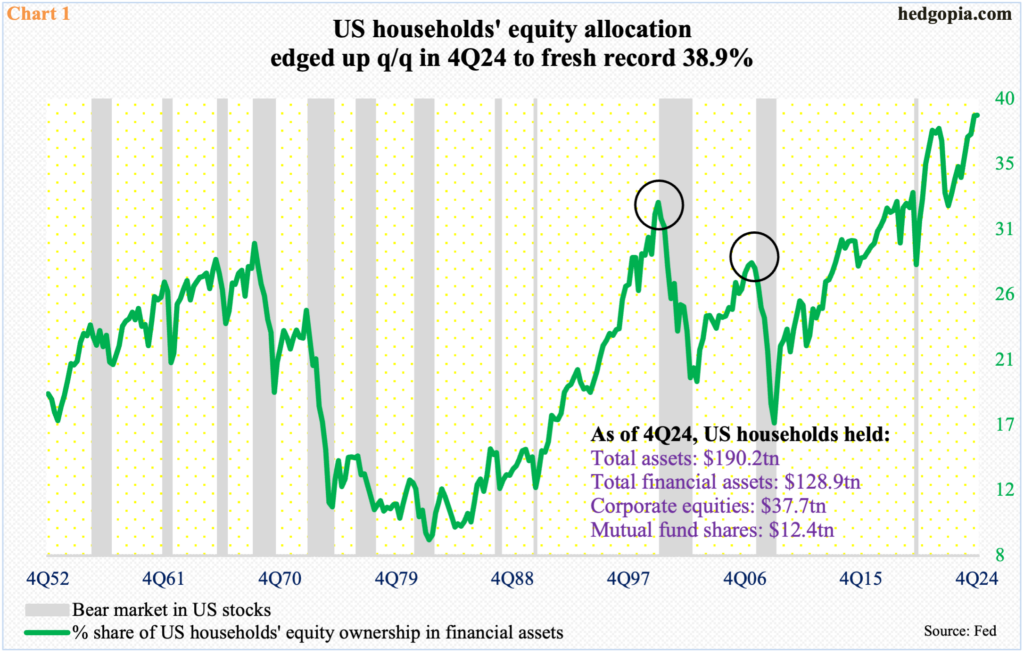
At the end of the December quarter, US households’ equity allocation edged up sequentially to a new high – 38.9 percent versus 38.8 percent during the September quarter (Chart 1).
Allocation is a full percentage point higher than the prior high of 37.9 percent at the end of 4Q21, not to mention 2Q07’s 28.3 percent and 1Q00’s 32.6 percent.
Surely, households’ equity exposure is lopsidedly extended. This in and of itself does not mean it has to begin unwinding right away, but risks grow with each push higher.
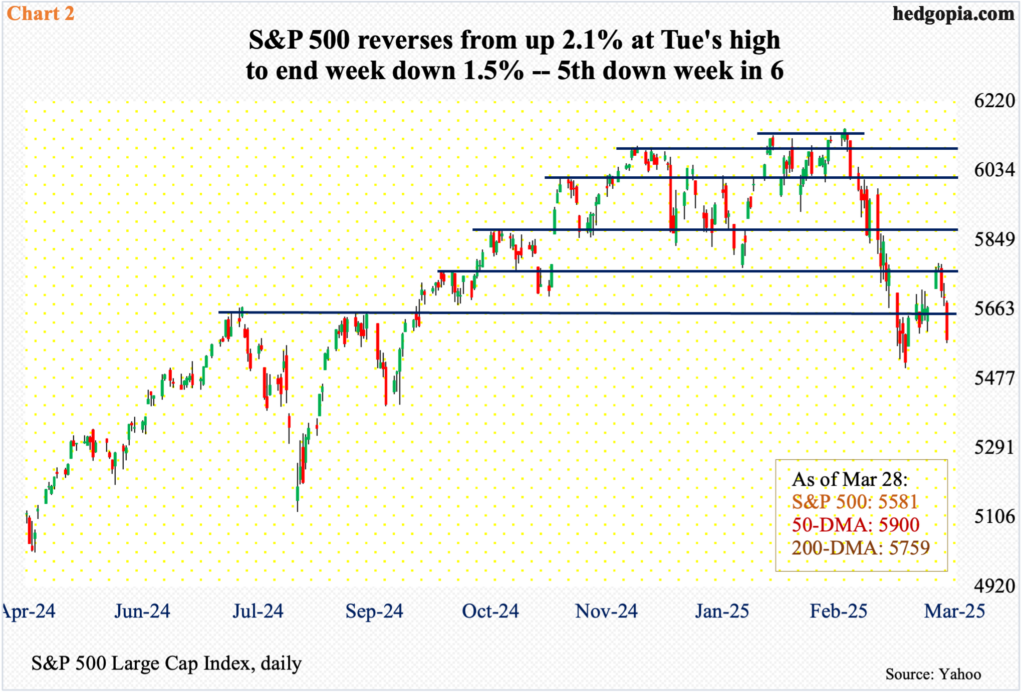
In 4Q, the S&P 500 rallied 2.1 percent to 5882. Its market cap went up $1.1 trillion quarter-over-quarter to $49.8 trillion. For the whole year, the large cap index shot up 23.3 percent, coming on the heels of gains of 24.2 percent in 2023.
Momentum continued in the first few weeks this year, as the index proceeded to rally to 6147 by February 19th. Then, it rolled over. By the 13th this month, it quickly tumbled 10.5 percent from that high to 5505. A relief rally followed, with the S&P 500 rising 5.1 percent from the low to 5787, before it hit a wall at dual resistance of the 200-day moving average (5759) and horizontal resistance at 5770s (Chart 2).
In the very near term, odds favor continued weakness. The March 13th low is 1.4 percent away, and it is a must-hold for the bulls.
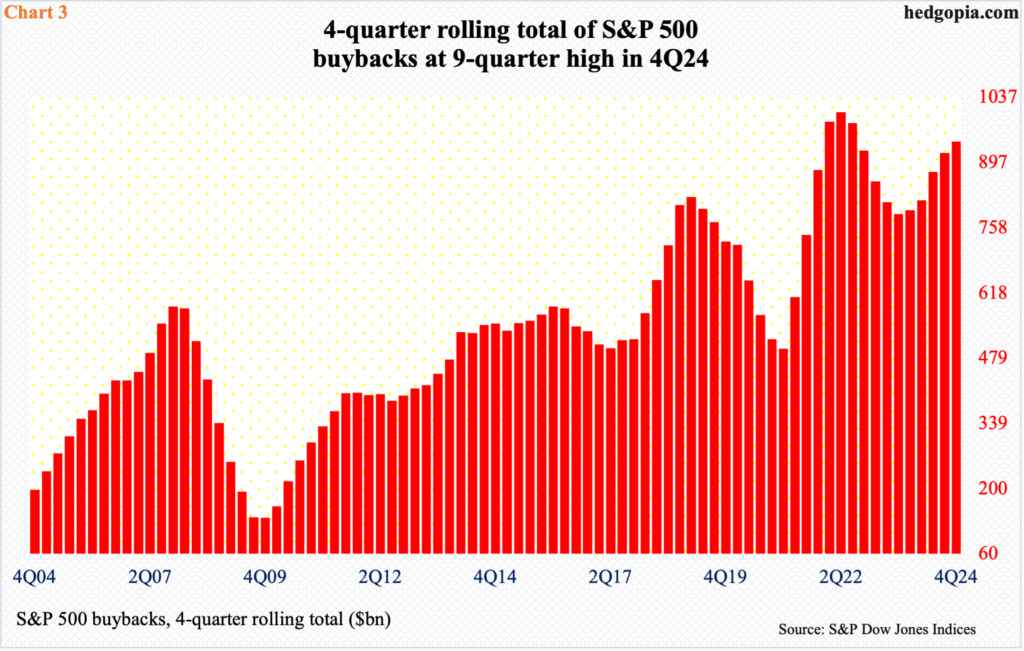
Buybacks, which have been a reliable source of tailwind for equities, will play a pivotal role.
In the December quarter, S&P 500 companies spent $243.2 billion in buying back their own shares. This was an 11-quarter high and compares with $167.6 billion in dividends.
On a four-quarter basis, 4Q24 buybacks were $942.5 billion – a nine-quarter high. On this timeframe, a record was set in 2Q22 at just north of a trillion dollars (Chart 3).
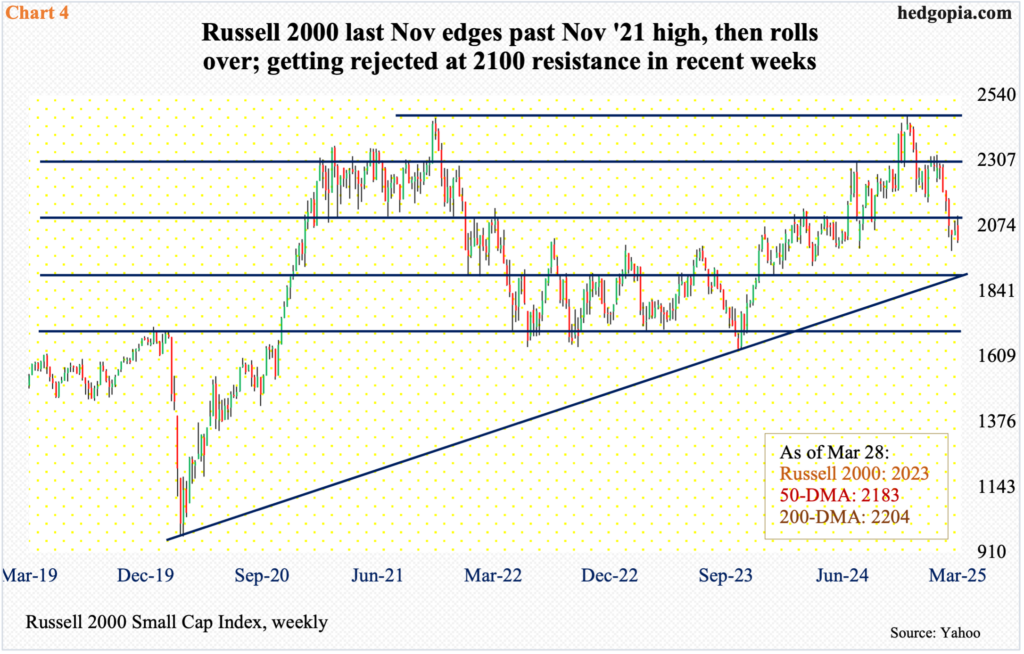
Small-caps were not as lucky as their large-cap cousins in the December quarter. The Russell 2000 ended the quarter flat. The index has come under pressure ever since it set a new intraday high of 2466 on November 25th last year, which was just enough to edge past the prior high of 2459 set in November 2021.
From last November’s high, the small cap index tumbled 19.5 percent through the 13th this month when it tagged 1985 intraday. A relief rally followed, and sellers showed up right where they had higher odds of succeeding.
The Russell 2000 broke out of 2100 last July, followed by a successful retest in September. Early this month, a breakout retest failed. This occurred again last week, as the index saw intraday highs of 2111, 2110 and 2104 respectively on Monday through Wednesday, but only to be rejected and end the week lower 1.6 percent to 2023 (Chart 4).
The March 13th low is 1.9 percent from here. This at a time when the Russell 2000 just completed a death cross, with the 50-day at 2183 and the 200-day at 2204. A test of that low is the path of least resistance.
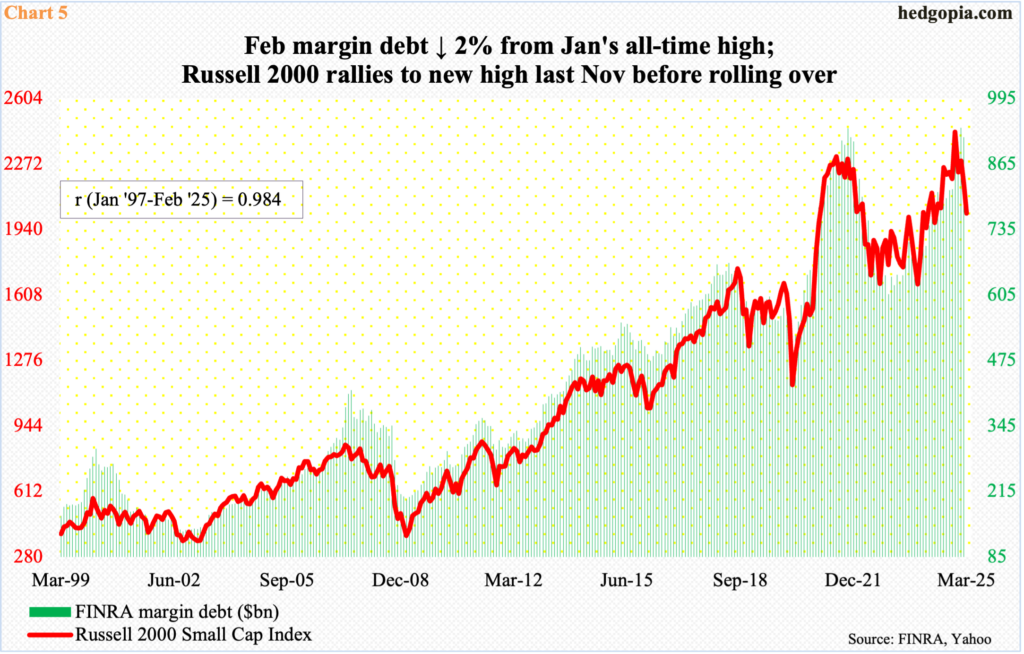
FINRA margin debt, which has a coefficient correlation of 0.98 with the Russell 2000 – slightly higher than the S&P 500 or the Nasdaq 100 – dropped $19.1 billion month-over-month in February to $918.1 billion. January’s $937.3 billion set a fresh record – just past the prior high of $935.9 billion from October 2021 (Chart 5). Back then, as mentioned earlier, the Russell 2000 peaked in November that year.
This time around, the two have diverged a little bit, with the Russell 2000 peaking last November and margin debt setting a new high in January. How the latter behaves in the months to come will reverberate not only through small-caps but large-caps as well. If this month’s lows are breached, then this has the potential to adversely impact margin debt.
Thanks for reading!
