
U.S. equity indices logged another week of gains. They bottomed on March 30. Amidst this feverish risk-on behavior, some early signs of risk-off showed up last week. Tech and small-caps both rose, with the Nasdaq 100 surging but the Russell 2000 unable to cling on to its high to form a weekly spinning top.
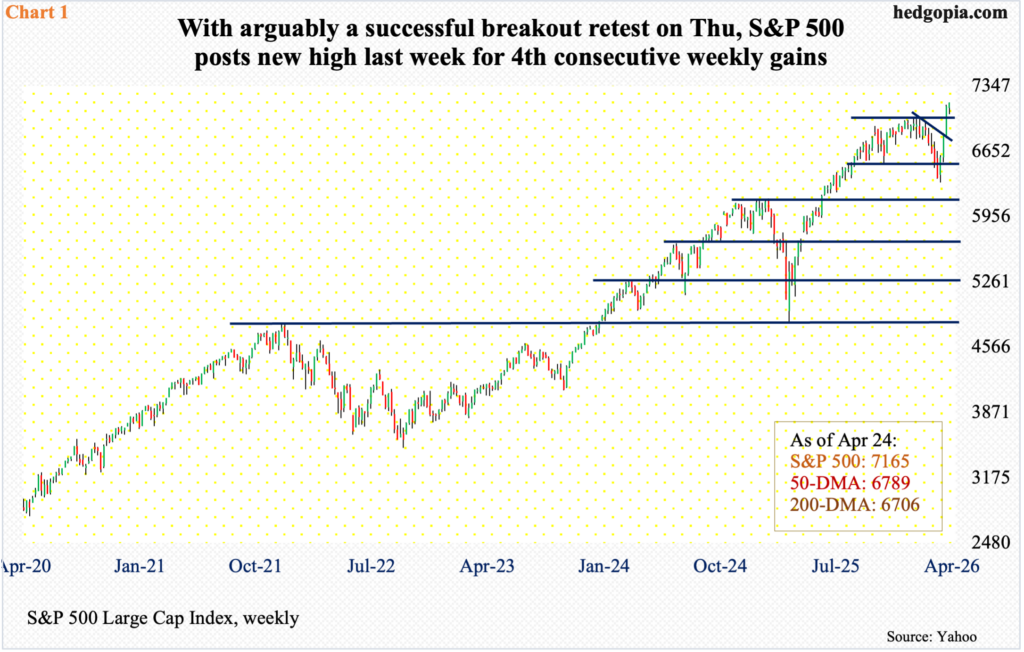
The S&P 500 continued on its merry way last week, having now rallied for four weeks in a row (Chart 1). It bottomed at 6317 on March 30 and finished the week up 0.6 percent to 7165, with an intraday high of 7169 on Friday.
Earlier, from 7002 reached on January 29, the large cap index dropped 9.8 percent before the bulls got their act together. They rallied past that high two weeks ago, and nearly experienced a successful breakout retest last week, with bids showing up at 7050 and 7047 respectively on Tuesday and Thursday; these lows also helped fill a gap from six sessions ago. Longs should be encouraged by this.
That said, four weeks of continuous uptrend has pushed most indicators into gross overbought territory. Immediately ahead, it will be interesting to see if bulls would be able to defend short-term lateral support at 7130s, and importantly just north of 7000 after that.
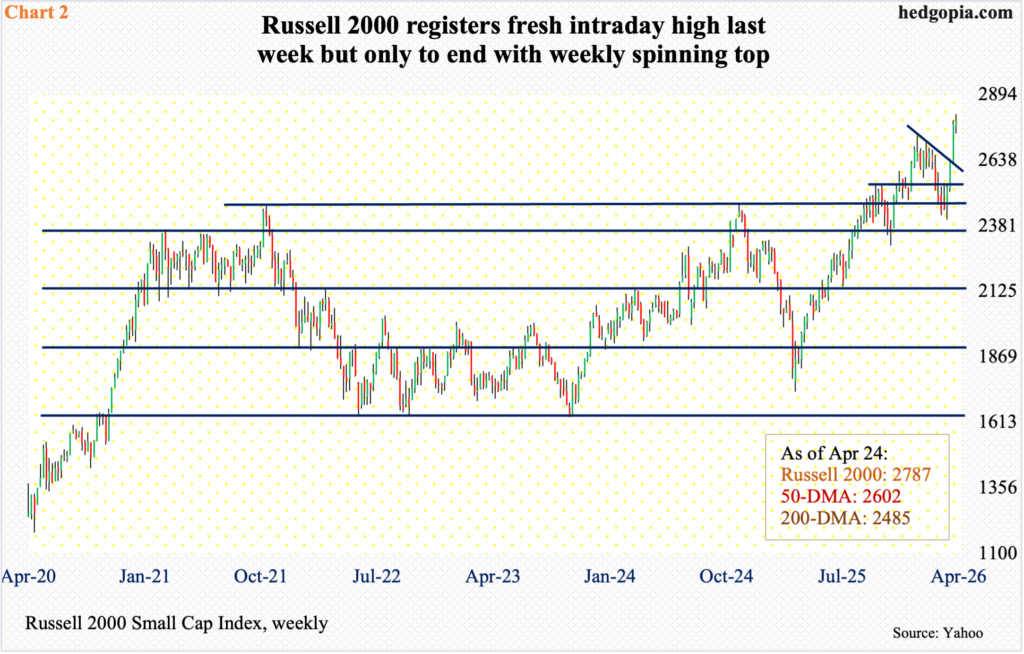
From the perspective of a successful breakout retest, the Russel 2000, too, witnessed one, although it failed to emulate its large-cap cousins as relates to weekly close. The small cap index finished up 0.4 percent to 2787 but only to end with a weekly spinning top. Bulls were unable to hang on to Tuesday’s intraday high of 2818. They did, however, pulled off a successful breakout retest at 2730s, as Thursday’s low 2742 was embraced.
Earlier on January 27, the Russell 2000 printed a fresh all-time high of 2735 and reversed lower, proceeding to set a series of lower highs, then bottoming at 2405 on March 30. A falling trendline from that high was broken to the upside a couple of weeks ago, preceded by a breakout at 2540s (Chart 2).
Despite all this, last week’s action should raise a caution flag. Small-caps by nature are risk-on, and last week’s is anything but a full-on risk-on. Bulls cannot be giving away 2730s.
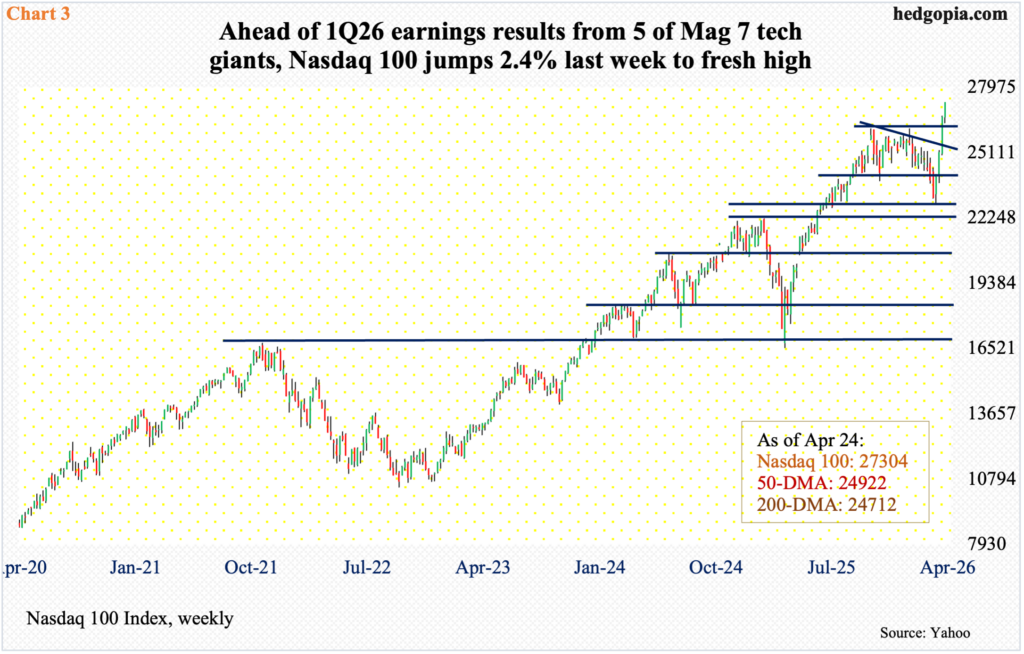
Tech gave off different vibes last week, continuing to exhibit risk-on. The positive momentum has now gone on for five weeks (Chart 3). Between the intraday low of 22,841 on March 30 and last week’s closing print of 27304, the Nasdaq 100 has shot up 19.5 percent, more than erasing the 12.8-percent loss between the October 29 high of 26182 and last month’s low.
Last week, the tech-heavy index closed just under its weekly high of 27314, jumping 2.4 percent for the week. This comes ahead of major tech earnings this week. Five of the Magnificent Seven, sporting a combined market cap of $15 trillion, report, with Microsoft (MSFT), Google parent Alphabet (GOOG), Amazon (AMZN) and Facebook parent Meta (META) publishing their March-quarter numbers on Wednesday and Apple (AAPL) on Thursday.
A lot is riding on these results, considering the gains the market-cap-weighted Nasdaq 100 have accumulated over a month. If a ‘buy the rumor, sell the news’ phenomenon unfolds, then a breakout retest at 26100s is key.
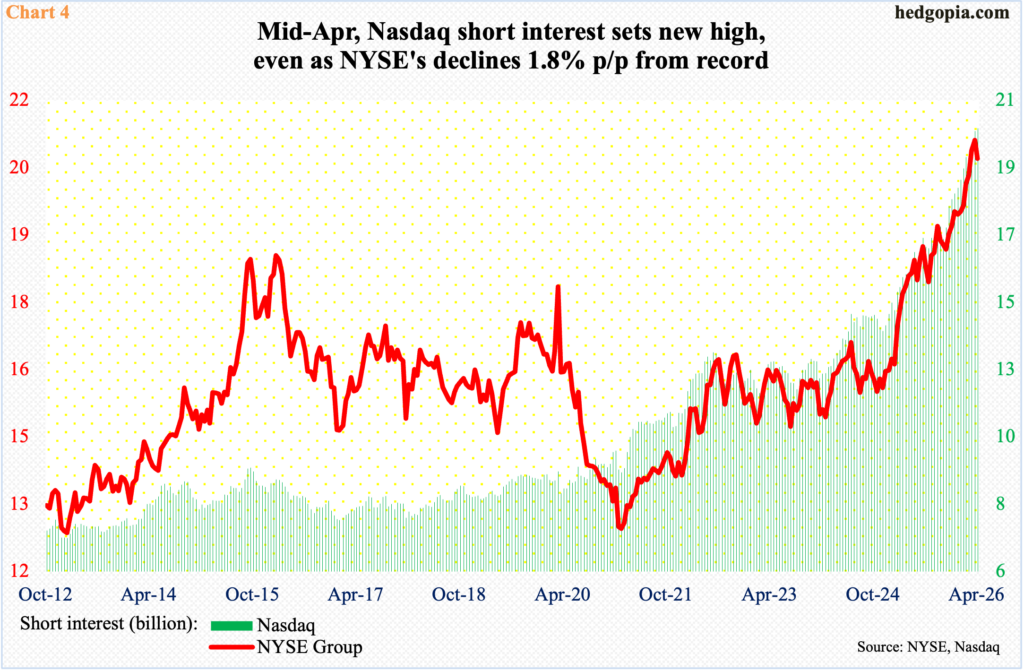
The irony is that, despite the massive gains made by these indices from the March lows, shorts, in a show of conviction, or denial, are staying put.
Mid-April, Nasdaq short interest rose 0.5 percent period over period to 20.5 billion – a record; on the NYSE, however, it dropped 1.8 percent p/p to 20.5 billion, but the prior period’s 20.9 billion was a record (Chart 4).
ETF-wise (not shown in chart), QQQ (Invesco QQQ Trust) short interest at 66.3 million mid-April was the highest since mid-December 2023; SPY’s (SPDR S&P 500 ETF) 1.34 billion at the end of March was the highest since mid-July 2023, with mid-April at 1.25 billion.
The point is, bears have continued to use the latest rally as an opportunity to add to shorts. If wrong, and if they are forced to cover, this will only end up helping the bulls, but it is a big if given how stretched these indices are.
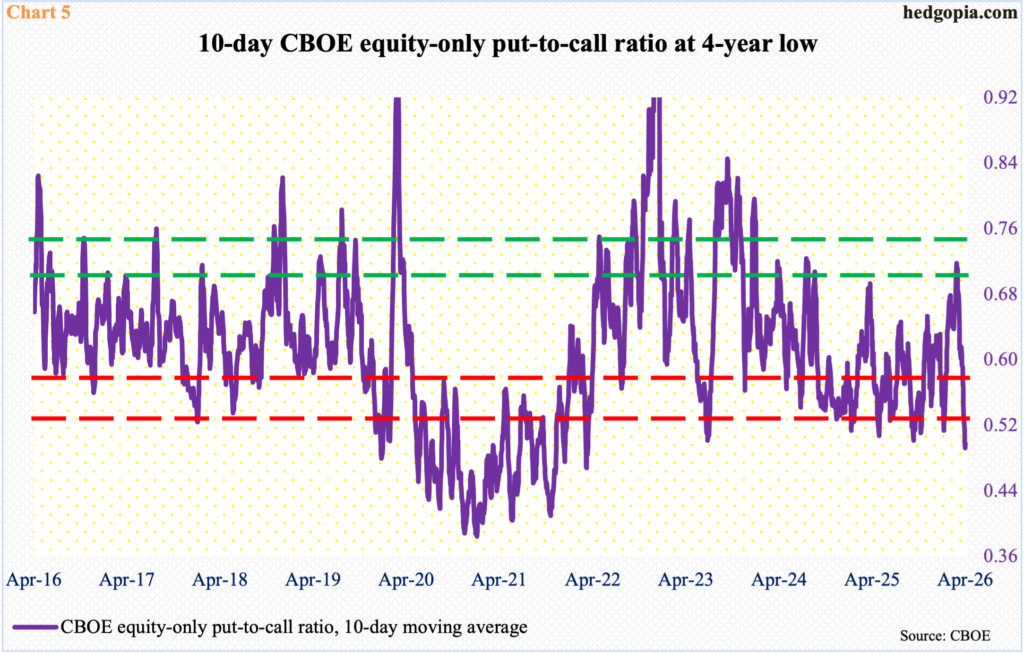
One such metric is the CBOE equity-only put-to-call ratio, which exudes tremendous optimism on the part of bulls – reflected in readings of 0.50s or lower, six of them in the 0.40s, for 13 consecutive sessions.
Last Friday, the 10-day moving average of the ratio finished at 0.498. This was the third consecutive session of sub-0.50 reading, with Wednesday’s 0.493 at a four-year low (Chart 5).
When these readings are this lop-sided to the bullish side, the five tech heavyweights reporting this week better deliver.
Thanks for reading!
