
Semi stocks have gone parabolic since the March low, helping the Nasdaq 100 attain massive gains; tech, in turn, has helped the broader S&P 500. The magnitude is always debatable, but some level of froth is forming in equities.
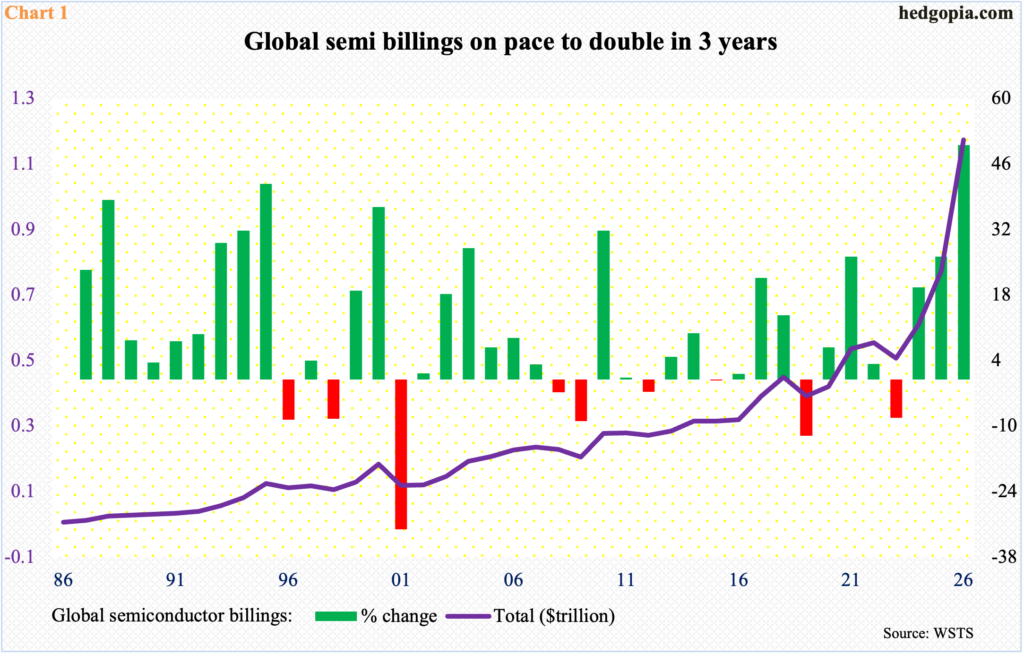
Thanks primarily to surging demand for AI infrastructure, global semiconductor sales are expected to reach nearly $1 trillion this year.
In the March quarter, World Semiconductor Trade Statistics data show, semi billings were $298.5 billion, up 79.2 percent from a year ago. Billings represent the value of shipments, representing future cash flow. Revenue is the amount of money recognized from shipped products, or when payment is recorded under accounting rules.
Annualizing the 1Q numbers, billings are on pace to exceed $1 trillion this year, growing 50 percent from last year’s $795.6 billion. Billings had a slightly negative year in 2023, coming in at $526.9 billion, and since have performed very strongly. There is a parabolic look to it (Chart 1).
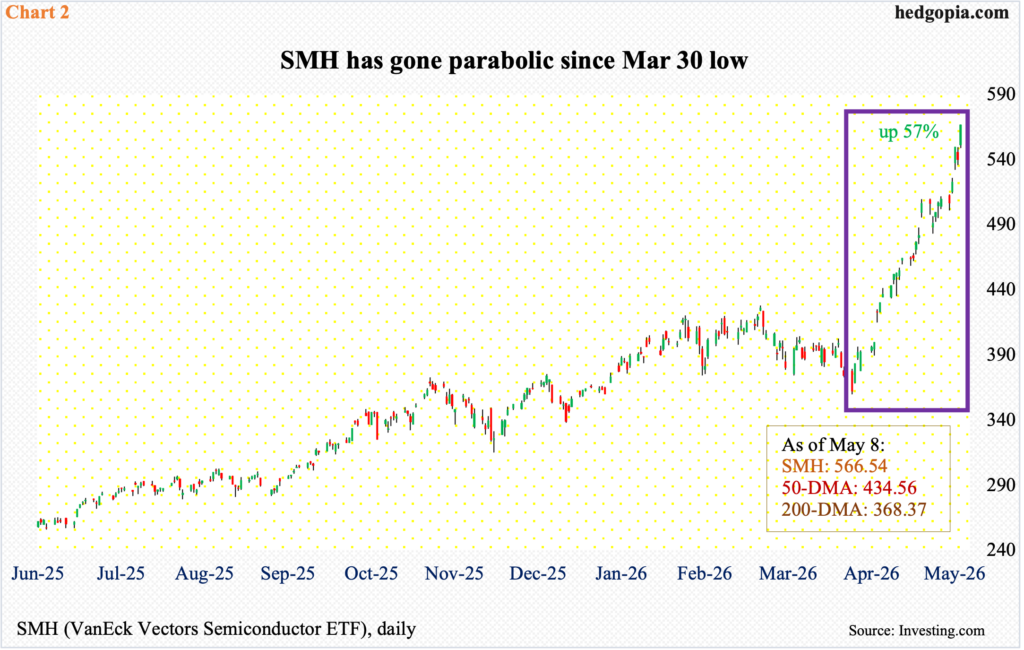
SMH (VanEck Vectors Semiconductor ETF) is wearing a similar look. From the low of April last year, it is up 234 percent to last Friday’s close $566.54.
More recently, it has had weekly gains for six consecutive weeks. Bottoming at the intraday low of $359.86 on March 30, the ETF is up 57 percent, with only five down sessions out of the 28 (Chart 2).
Momentum is aggressively strong, with the daily RSI closing last Friday at 80.91 and the weekly at 84.52.
It seems there is a rush to get in on the action, and it has paid off thus far for the longs. The danger in this kind of trade is that momentum can easily swing the other way at the slightest warning.
Chip names have been so dominant that they make up four of the top 10 in QQQ (Invesco QQQ Trust), with Nvidia (NVDA) – the company with the largest market cap in history at $5.2 trillion – leading the way; the other three are: Micron (MU, $842 billion), Advanced Micro Devices (AMD, $742 billion) and Broadcom (AVGO, $2 trillion). Intel (INTC), which at $628 billion has surged 559 percent since last July’s low, occupies the 12th position in QQQ. From the lows of last April, MU has shot up 1,116 percent, AMD 495 percent and AVGO 214 percent!
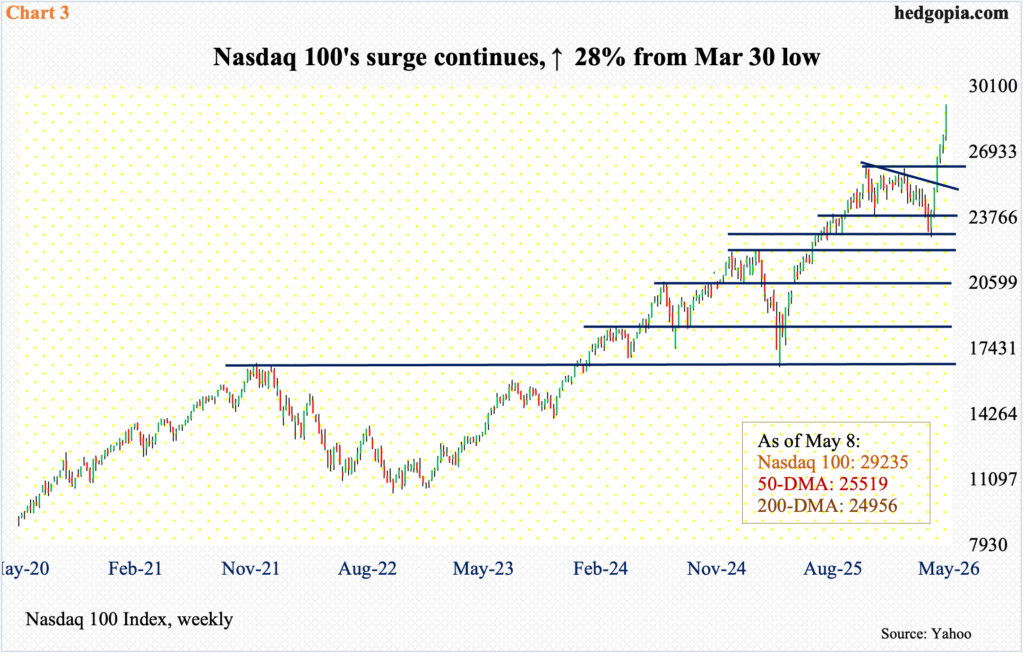
These ridiculous-looking gains have helped the Nasdaq 100 rally 78 percent from the low of April last year. Last week, after five consecutive weeks of gains, it added another 5.5 percent to 29235, with Friday’s session forming a bullish marubozu. From the intraday low 22841 on March 30, the tech-heavy index is up 28 percent.
Momentum is strong but at the same time could be too strong for its own good; the weekly RSI ended last week at 74.22 and the daily 82.59.
There is major breakout support at 26100s (Chart 3).
Like how semis have helped the Nasdaq 100, tech in general has done the same to the broader S&P 500. In SPY (SPDR S&P 500 ETF), in the top 10, except for Berkshire Hathway (BRK) and JP Morgan (JPM), it is all tech – NVDA, Apple (APPL), Microsoft (MSFT), Amazon (AMZN), Google parent Alphabet (GOOG), AVGO, Facebook parent META Platforms (META) and Tesla (TSLA), which have a combined market cap of nearly $23 trillion and command a dominant 38 percent share in the ETF.
It will not be an exaggeration to say that as semis go so goes the Nasdaq 100, and as tech goes so goes the S&P 500.
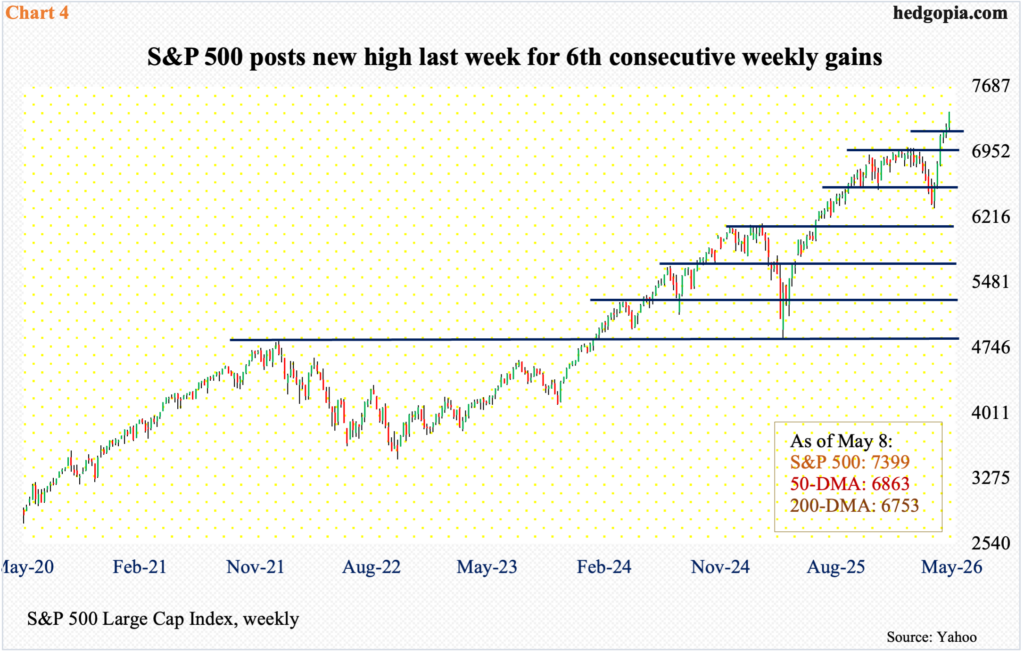
The large cap index, too, has had six weeks of gains in a row. From the March 30 low through last Friday’s intraday high of 7402, the S&P 500 is up just north of 17 percent. Along the way, bulls have managed to forge an important breakout at 7000 (Chart 4).
With these kinds of uninterrupted gains, the index of course remains deeply overbought – particularly on the daily – although bears thus far have failed to cash in on any opening that came their way. Last week, the S&P 500 closed at 7399. Nearest support lies at 7270s, followed by 7140s.
Small-caps, too, have had their share of success the last six weeks. They do not trade at the beck and call of tech but for the most part will not remain aloof from which way the dominant large-caps go.
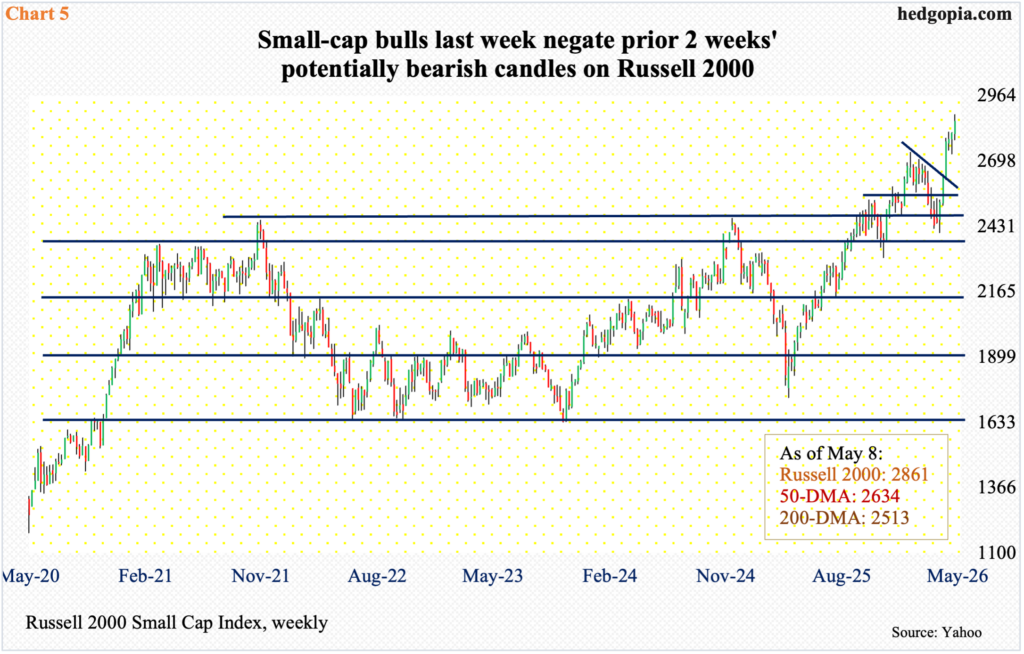
From the March 30 low, the Russell 2000 is up just over 20 percent. Last week, bears were unable to capitalize on potentially bearish weekly candles back-to-back – a hanging man preceded by a spinning top. Bulls instead rallied the index 1.7 percent to 2861 to nulify the two candles.
Bulls’ mettle will be tested – whenever that is – at 2730s (Chart 5). On January 27, the Russell 2000 peaked at 2735, which was then recaptured four weeks ago. As things stand, the level is a make-or-break for bulls and bears alike.
Thanks for reading!
