
Despite risks pertaining to geopolitics, inflation, interest rates, and what not, US equity indices continue to defy gravity – jumping 20 percent to 30 percent the past couple of months. Corporate profits have provided a steady tailwind.
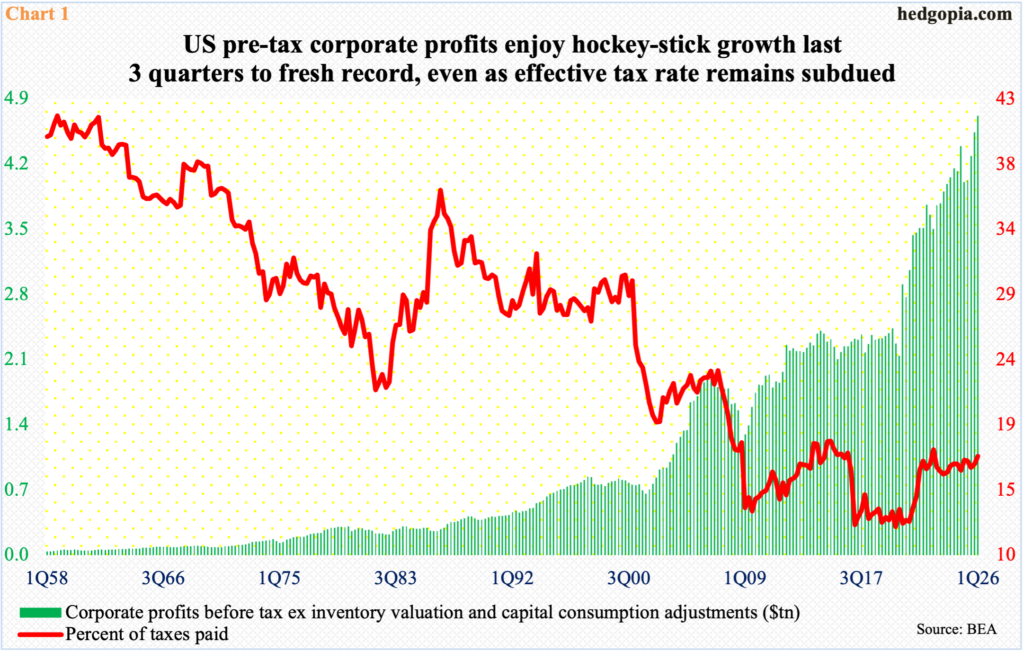
In the March quarter, pre-tax corporate profits before adjusting for inventory valuation and capital consumption increased four percent sequentially to $4.72 trillion – a record. From a year ago, profits shot up 17.8 percent, which was the best showing in 17 quarters. Profits have particularly taken a hockey-stick look the last three quarters (Chart 1).
In the meantime, taxes on corporate income were $802.5 billion in 1Q, which also set a record; this amounts to 17 percent of profits before tax; the effective tax rate, having gradually risen from the record lows of five to six years ago, was at a 13-quarter high, although it has been much higher in the past.
Surging profits overall have helped provide a reliable tailwind to the major equity indices, which keep making new highs.
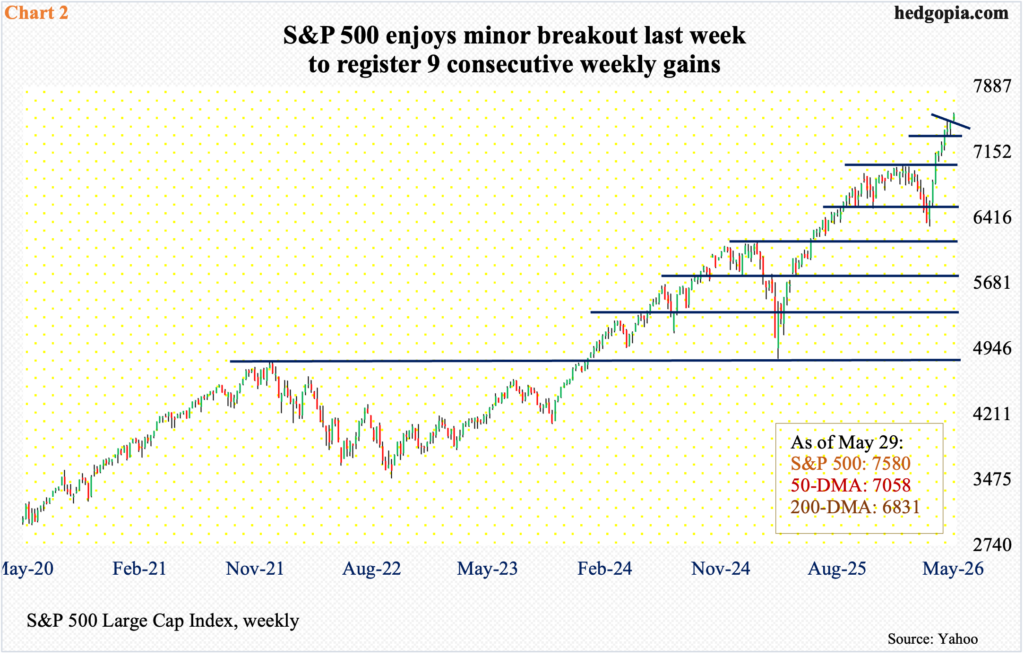
On the S&P 500, the latest fresh record was registered last Friday when it ticked 7599 intraday, closing the session/week at 7580, up 1.4 percent for a breakout week (Chart 2). This was the ninth up week in a row. The large cap index earlier bottomed at 6317 on March 30.
Upside momentum has been very strong, driving most technical indicators into gross overbought territory. The daily RSI (73.5) for the most part has stayed in the 70s since mid-April, with occasional drops into the mid- to high-60s. Any drop in momentum has failed to sustain, with the bulls ready to pounce on any weakness.
The most recent low occurred on May 19 when the S&P 500 tagged 7334, before rallying for the next seven sessions in a row, although the most recent candles are signaling some fatigue, with last Friday’s doji preceded by Wednesday’s hanging man, Tuesday’s spinning top and a shooting star on Friday before that. If these candles amount to anything for the bears, nearest support lies at 7500, and 7330s after that. With gains of 20.3 percent from March 30, bulls can easily stomach a minor downward pressure.
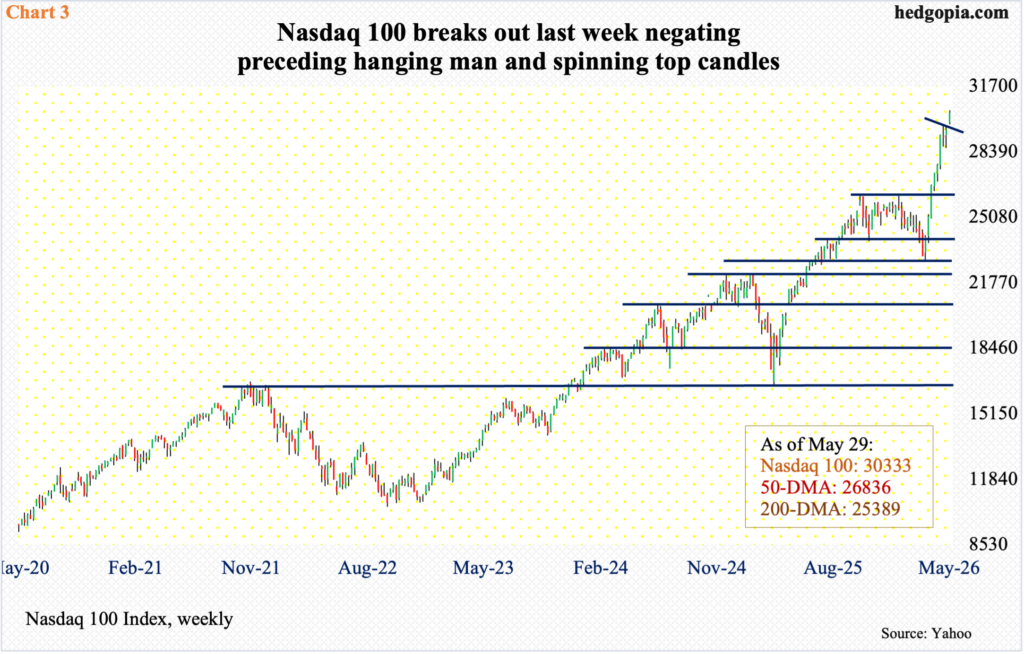
From March 30 through Friday’s all-time high 30470, the Nasdaq 100 is up 33.4 percent. Last week, it jumped 2.9 percent to 30333; the move thus far has invalidated the potentially bearish candles of the prior two weeks – a weekly hanging man and a spinning top before that.
Like the S&P 500, the tech-heavy index, too, enjoyed a minor breakout last week (Chart 3), even as the daily RSI (77) except for a few sessions in the middle of last month has remained in the 70s to low-80s since mid-April; the weekly RSI closed last week at 77.1.
Conditions are overbought but have been that way for a while now. Bears, for their part, have failed to sustainably capitalize on what chances came their way. In the event the Nasdaq 100 comes under pressure in the sessions ahead, nearest support lies at 29600s.
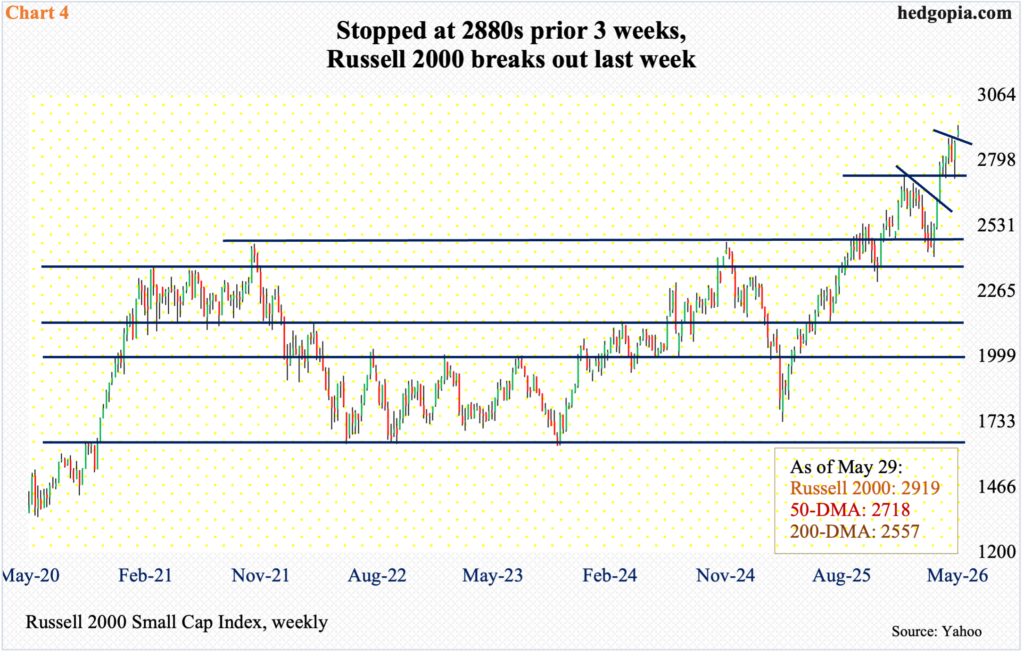
Similar support on the Russell 2000 lies at 2880s, and this will be a breakout retest. Last week, small-cap bulls experienced a mini breakout at that level, rallying 1.8 percent to 2919. They had failed to push through 2880s in the prior three weeks, with highs of 2879, 2888 and 2889 (Chart 4).
Last week’s 2880s breakout followed a successful breakout retest in the preceding week at 2730s. The Russell 2000 peaked at 2735 on January 27; the level was reclaimed eight weeks ago, followed by a successful retest six weeks ago. On May 19, bids were waiting near the level as the dip to 2747 was bought.
Odds favor a 2880s retest soon. Bulls last week were unable to hang on to Thursday’s all-time high 2943. The Russell 2000 has rallied in eight of last nine weeks. A little fatigue should not come as a surprise. Bears will only have significantly enhanced their chances should 2730s give way.
Thanks for reading!
