
With the Fed seemingly focused on price stability, and odds of a hike in the benchmark rates rising, small-caps atypically are outperforming their large-cap peers of late.
The creation of 57,000 non-farm jobs in June fell well short of the 115,000 consensus, even as the unemployment rate edged lower to 4.2 percent primarily because of a shrinking labor force rather than robust hiring.
That said, in the first six months this year, the economy has created a monthly average of 92,000 jobs, much better than last year’s showing of 10,000/month. The uptick in hiring this year has not really put upward pressure on the private sector’s average hourly earnings, which came in at $37.64 in June, up 3.5 percent from a year ago; in June last year, earnings grew 3.9 percent year over year.
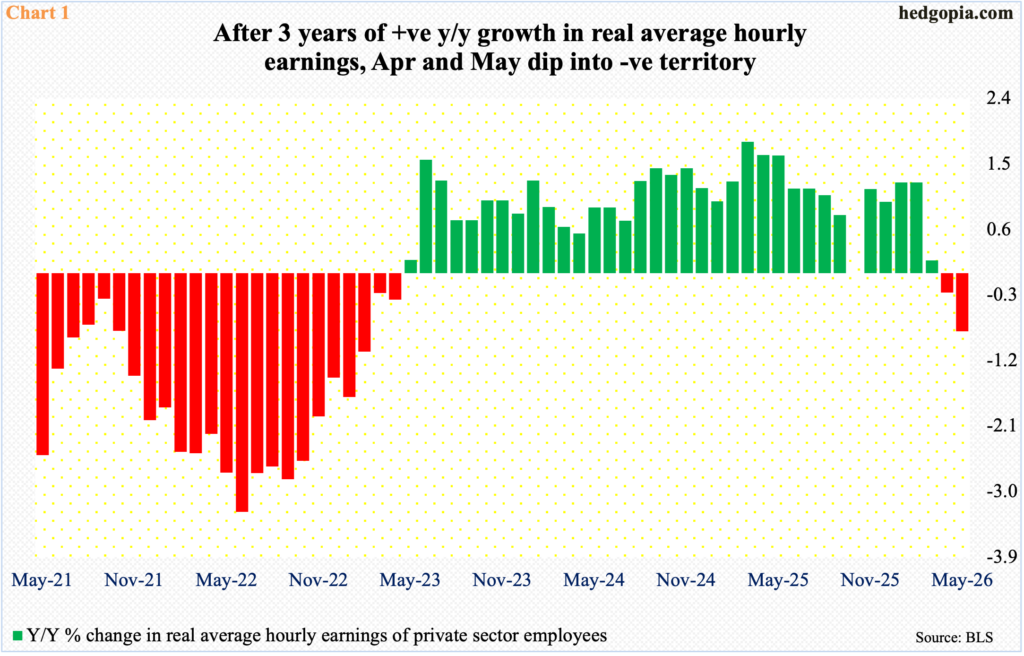
Nominal hourly earnings nevertheless are growing at a healthy clip. The same cannot be said of real hourly earnings, which at $11.23 in May fell from $11.32 in May last year. This, in fact, was a second monthly contraction in real earnings from a year ago. This was preceded by three years of positive growth (Chart 1).
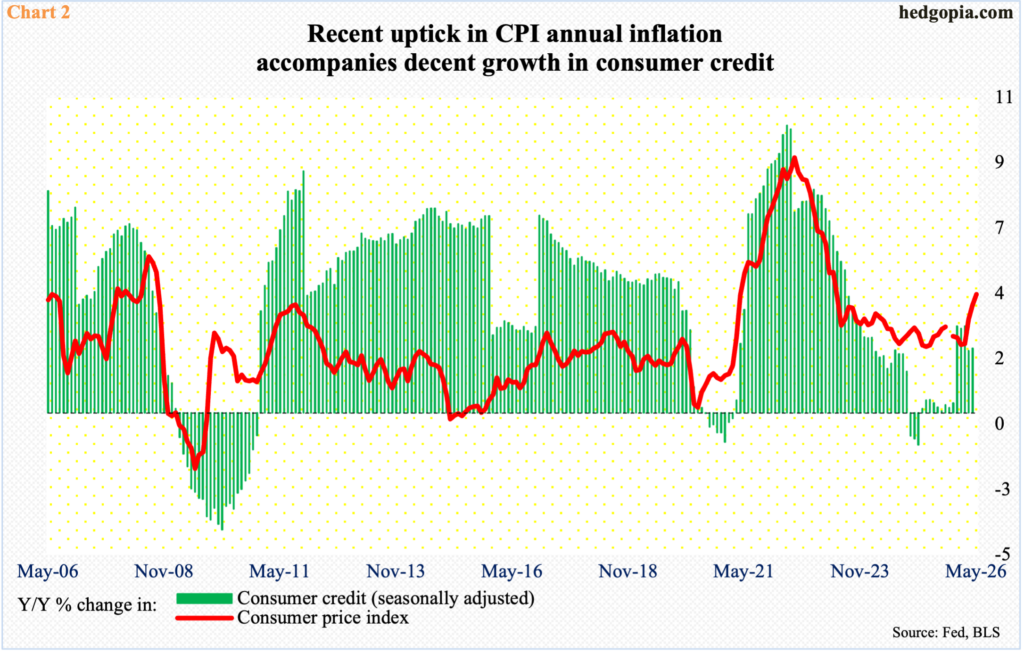
The rather elevated inflation numbers are cutting into hourly earnings. In May, headline and core CPI (consumer price index) increased at an annual rate of 4.3 percent and 3.9 percent respectively; this was the fastest pace in 37 and seven months, in that order. Headline CPI bottomed in April last year at 2.3 percent, while the core did so at 2.5 percent in February this year. The trend since has been up.
The recent uptick in the CPI is in line with the recent positive momentum seen in consumer credit. In April, consumer credit rose 2.3 percent from a year ago to $5.2 trillion, made up of $1.4 trillion in revolving and $3.8 trillion in non-revolving.
May’s numbers are due out Thursday, and it will be interesting to see if the momentum seen in consumer credit from last December will continue; growth has been coming in at a two to three percent range. As recently as last August, consumer credit had decelerated to a year-over-year rise of 0.1 percent (Chart 2).
If consumer credit continues to grow at a decent pace, then this would have taken place at a time when interest rates are headed higher. The 10-year treasury yield rallied from 3.96 percent from February 27 to 4.69 percent on May 19 before cooling off a bit to close last week at 4.49 percent. On the short end of the yield curve, the fed funds rate has been left at a range of 350 basis points to 375 basis points since last December, but markets are increasingly convinced that the next move in the benchmark rates is up not down, with futures traders pricing in a 25-basis-point hike by October with more than three-fifths certainty; until just a few months ago, the FOMC was expected to deliver at least two cuts this year.
It is one thing if interest rates go up because of improvement in the economy, it is another if they rally responding to upward price pressures. As things stand, the economy is hanging in there, but price pressures are building. At last month’s FOMC meeting, newly appointed Federal Reserve Chairman Kevin Warsh could not have been clearer saying “this committee will deliver price stability.” Speaking at an ECB forum last week, he once again said that inflation remains too elevated.
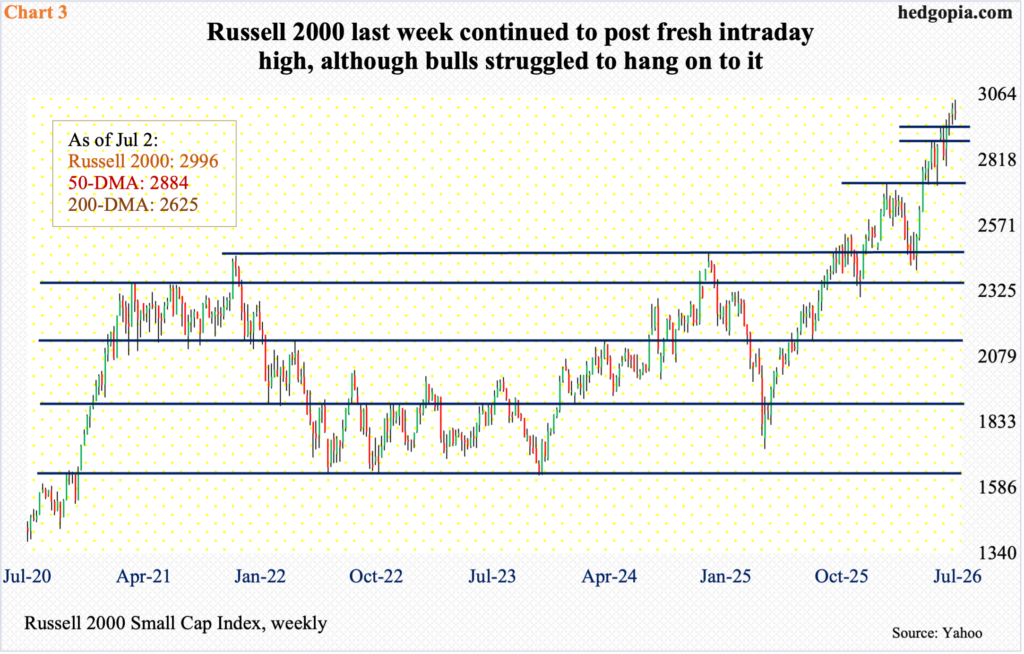
Small-caps, which tend to have a high exposure to the domestic economy versus their mid- to large-cap peers, also tend to be more leveraged. The risk of rising rates going forward is not reflected in how the Russell 2000 trades. As a matter of fact, the small cap index posted a fresh intraday high of 3047 last Wednesday, before closing the holiday-shortened week at 2996, down 0.5 percent for the week.
The index has come a long way from the March 30 low of 2405 and remains overbought on particularly the weekly. In the event of a drawdown, 2940s is worth watching immediately ahead. After this lies 2880s, which stopped the bulls for a few weeks before a breakout occurred six weeks ago (Chart 3). The Russell 2000 needs to drop 3.7 percent before the 50-day moving average (2884) is tested.
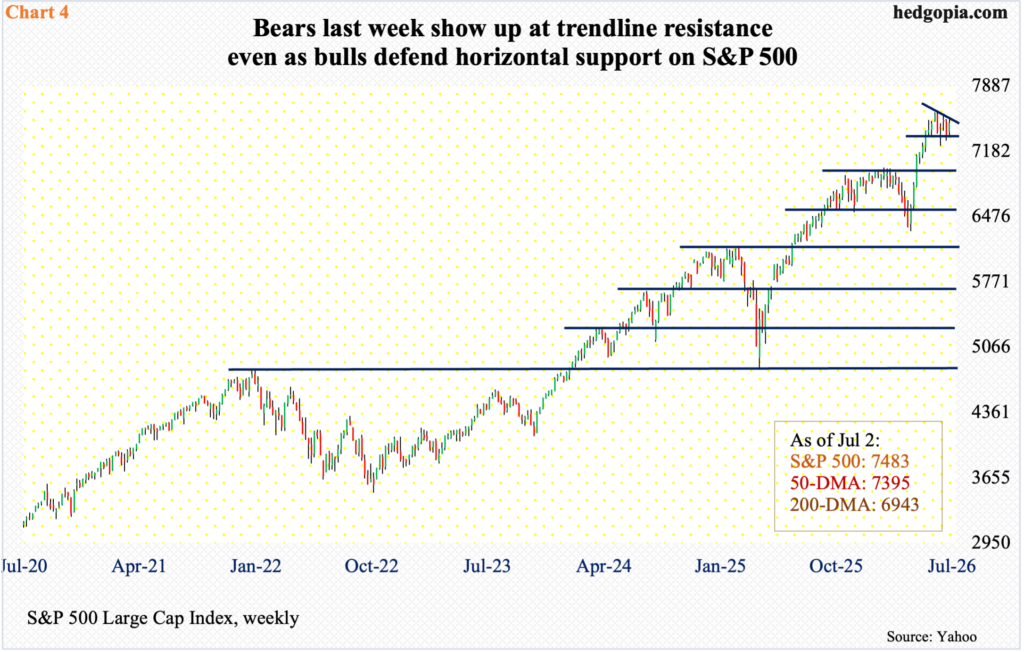
The situation is different in large-cap indices, including the S&P 500, which peaked on June 2 at 7621. A falling trendline thereof has resisted rally attempts, including last week when both Tuesday and Wednesday ended in a spinning top, although the week was up 1.8 percent to 7483.
Both bulls and bears were unwilling to leave their turf last week, with the former defending horizontal support at 7330s and the former showing up at the trendline resistance in question (Chart 4).
More important perhaps is the fact that the large cap index is not that far away from its 50-day (7395). Five sessions ago, in fact, the average was breached for one session.
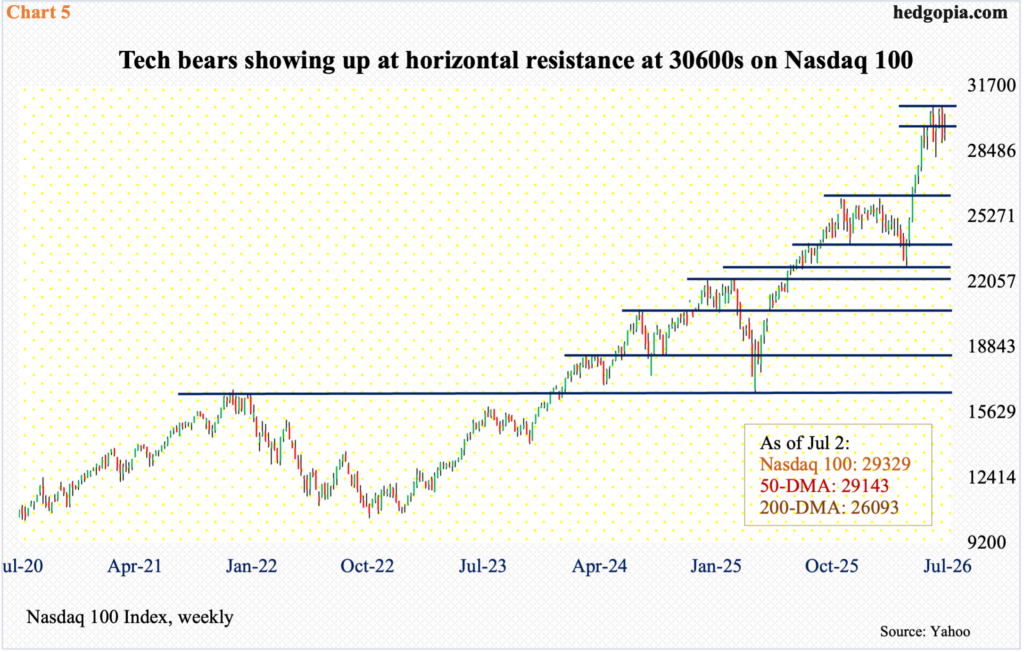
Speaking of the 50-day (29143), the average was tested last Thursday on the Nasdaq 100, with a session low of 29087 and a close of 29329, up 0.7 percent for the week. The tech-heavy index has essentially hugged the average for several sessions now, with a high of 30329 last Tuesday.
The Nasdaq 100 peaked on June 3 at 30762, with solid horizontal resistance at 30600s, where bears are showing up. They would have built on it if they succeed in recapturing the 50-day. This likely also tempts the longs into locking in at least some of their paper gains. The index shot up 34.7 percent from March 30 when it bottomed at 22841.
Thanks for reading!
