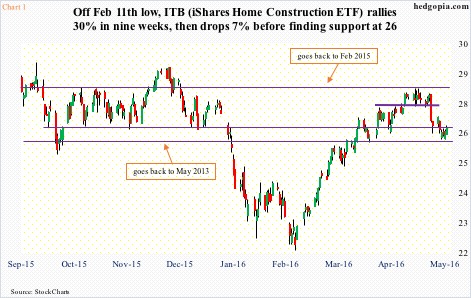
From up 30.2 percent between February 11th low and April 21st high to down 7.3 percent since that high, ITB, the iShares U.S. home construction ETF, has had its share of ups and downs.
There is likely a crossover in the making between 50- and 200-day moving averages, with the former rising and the latter flat, and a mere penny separating the two. The last time a golden cross developed on ITB was on December 1st even as the ETF peaked at just under $29.
So these crosses, despite their bullish connotations, do not always turn out as expected. That said, unlike back in December, this one will take place amid oversold technical conditions. Back then, daily conditions were grossly overbought.
This is potentially important as support at $26, which goes back three years, was tested last week – so far successfully. Early on yesterday, it rallied strong – up one percent at one time – but was repelled at the 50/200, in the end closing up 0.5 percent.
As Chart 1 shows, ITB has been range-bound between $26 and $28 for a while now. This time around, it travelled from the top of the range to the bottom in three weeks.
Daily technicals are oversold, and in the right circumstances ITB has room to push higher near term, ideally to the top of the range.
However, there is this.
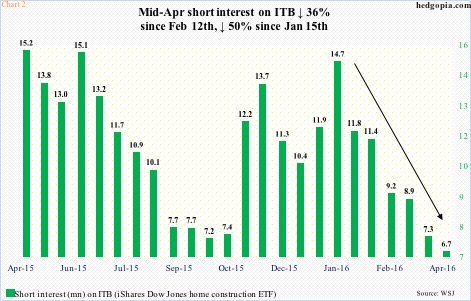
Short interest is no longer a tailwind as it was in the past.
Short interest on ITB fell 8.5 percent to 6.7 million in the April 15th period. Of late, shorts have paid a big price staying short this thing, with short interest down 36 percent from February 12th and down 50 percent from January 15th. Squeeze fuel is drying up (Chart 2). (End-April data will be published later today.)
This, even as weekly conditions are in overbought territory. Momentum indicators are under pressure, and have a ways to go before overbought conditions are unwound.
Given this, it is probably worthwhile to stay short ITB. Near-term, tactically, some additional strategy can be conjured up using options.
To recall, back on April 20th, ITB ($26.49) was shorted at $27.66. Shorts can either (1) cover, (2) stay short, or (3) stay short but deploy options.
If weekly indicators win over, ITB in due course likely drops out of the afore-mentioned range. But that may take time. In this scenario, short put can help.
Hypothetically, May 13th weekly 26 puts bring $0.20. This is not a whole lot of premium, but, if unassigned, helps raise the price ITB was shorted at to $27.86. If assigned, the position gets covered for a profit of $1.86.
Thanks for reading!

