Regardless whether or not it is solely related to the outcome of the November 8 U.S. presidential election, several data points have seen an uptick since.
Stocks rallied, with the S&P 500 large cap index up nearly six percent between election and inaugural day.
Consumer sentiment, measured by the University of Michigan’s consumer sentiment index, shot up 6.6 points month-over-month in November and then another 4.4 points in December to 98.2. This was the highest monthly reading since 103.8 in January 2004 (Chart 1).
Further, the two-month, 11-point jump last December was the largest since January 2012 when sentiment jumped 11.3 points in two months.
There was a similar spurt in small-business optimism.
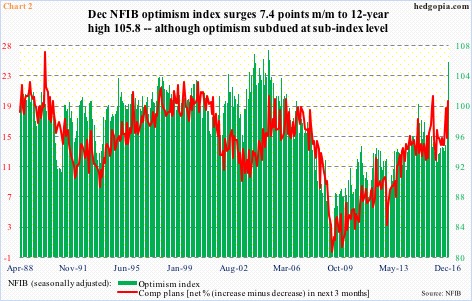
The National Federation of Independent Business optimism index increased 3.5 points m/m in November, followed by a rise of another 7.4 points in December to 105.8. This was the highest reading since 106.1 in December 2004. The 10.9-point jump over two months was the largest in the series’ history (data goes back to January 1986).
As growth optimism got a boost post-election, so did inflation expectations.
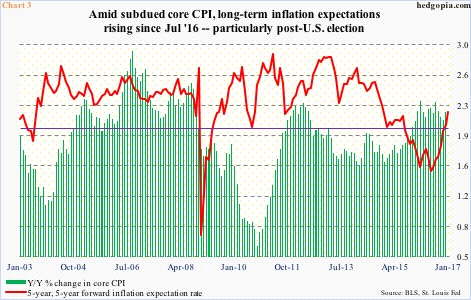
Chart 3 plots year-over-year percent change in core CPI (consumer price index) with inflation expectations. The latter is represented by five-year, five-year forward inflation expectation rate.
The red line in Chart 3 has been under pressure since February 2013 when it read 2.86 percent … until June last year when it bottomed at 1.5 percent. It has gradually moved higher since. In October, it stood at 1.79 percent, then jumped 18 basis points m/m to 2.97 percent in November. It rose further in December, to 2.05 percent. As of last Monday, it stood at 2.19 percent.
Optimism is beginning to get reflected in earnings expectations as well.
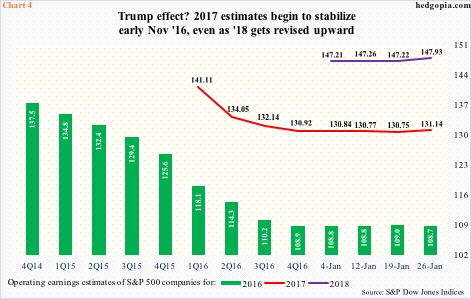
Operating earnings estimates for S&P 500 companies for this year were $141.11 one year ago. Then the knife came out. That said, estimates have essentially gone sideways for nearly three months now – $131.18 on November 3 last year versus $131.14 last Thursday. If these estimates come through, earnings would have grown this year in excess of 20 percent!
Importantly, 2017 estimates began to stabilize right around the U.S. election.
Similarly, 2018 estimates have gone from $147.21 on the 4th this month to $147.93 last Thursday. As elevated as these estimates look, the revision trend is up, not down!
Here is the thing.
The post-election optimism seen in consumer sentiment, NFIB survey, and inflation expectations comes with a twist.
Nothing goes up in a straight line, but after the initial two-month euphoria, consumer sentiment only inched up three-tenths of a point in January.
Small-business optimism shot up in November and December, but other variables in the same survey continued to lag. Small businesses’ compensation plans, for instance, were 19 in October and 20 in December (Chart 2).
Along the same lines, inflation expectations have been rising but this is nothing in a larger scheme of things. Core CPI continues to remain suppressed, even though it has come in north of two percent for the last 14 months. Core PCE (personal consumption expenditures) – the Fed’s favorite measure of consumer inflation – has been sub-two percent since May 2012.
Hence the risk that it is only a matter of time before earnings expectations for both this year and next get a reality check.
For reference, 2016 estimates were $137.50 in February 2015, now they are at $108.66. Similarly, 2015 estimates were $137.50 in 2Q14; when it was all said and done, it earned $100.45 (not shown here).
Long story short, it is one thing to stay optimistic, but another to stay unrealistically optimistic.
Thanks for reading!

