The following are futures positions of non-commercials as of January 13 (Tuesday). Change is week-over-week.
Dollar index and E-mini S&P 500 are noticeable.
10-year note: Did non-commercials get squeezed a little this week? By Tuesday, the 10-year yield had dropped another 80 basis points for the week. Net shorts were cut by 25 percent (down 31 percent from two weeks ago). Nevertheless, these are still sizable positions. On Friday, the 10-year yield fell to 1.7 percent intra-day, then reversed higher. Technically, it is itching to move higher at least in the short term. Currently non-commercials are net short 181.6k, down 61.6k w/w.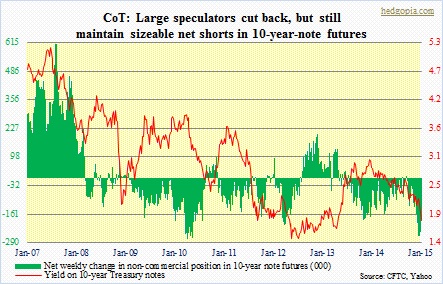
30-year bond: After a long period of net long exposure, they have continued to stay net short – five weeks running – though positions are relatively small. Yield on the 30-year made an all-time low of 2.35 percent on Friday before reversing higher. As with the 10-year, the 30-year yield seems headed higher for now. Currently net short 19.3k, down 16k.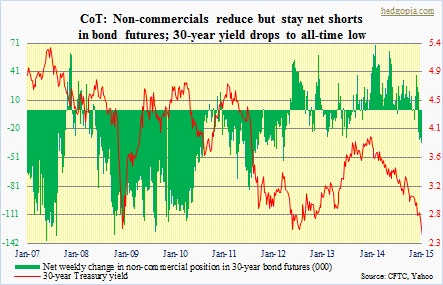
Crude oil: The WTI chart is a little misleading as it uses the weekly close. On a daily basis, price dropped all the way down to $44.20 on Tuesday. Buyers are stepping in. As are large speculators. The latter has been adding to net longs in ‘crude oil, light sweet–WTI’. They are at a 15-week high. Notice the spike the past three weeks. Currently net long 49.8k, up 16.8k.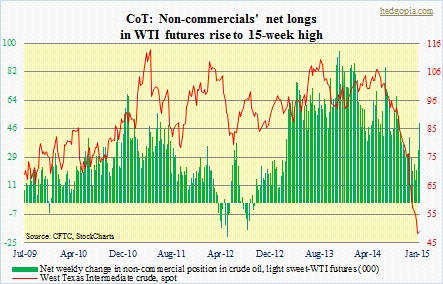
E-mini S&P 500: After having raised net longs last week to the highest level since end-July 2013, they cut back this week. The S&P 500 was down 1.2 percent for the week. Bulls should like Friday’s action. A bounce seems imminent (already saw that on Friday). Currently net long 115.8k, down 54.7k. Reminder: positions are as of Tuesday, so do not reflect Friday’s tape.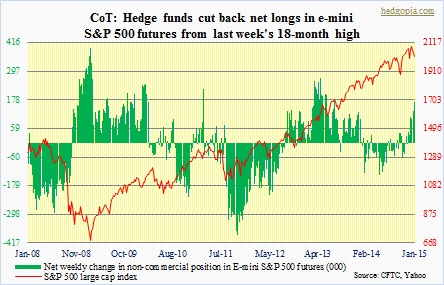
Euro: Net shorts have been maintained since the middle of May, as the currency was getting ready to fall off a cliff. Large speculators have ridden the euro downturn very well. Post-Swiss National Bank decision, the currency fell off a cliff on Thursday and Friday. There are some signs of an exhaustion gap. Euro bulls should like how this thing traded on Friday. Currently net short 167.9k, up 6.8k.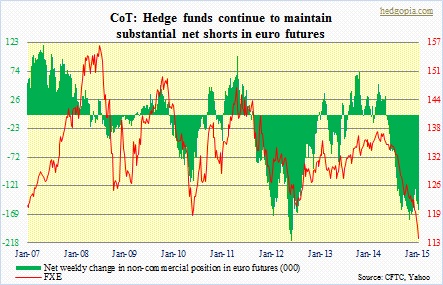
Gold: Net longs rise to 21-week high. Gold had already been acting well. And the SNB decision to delink from the euro literally lit a fire under the metal – up nearly four percent on Thursday and Friday. It broke out of a rising three-month-long channel, took out the 200-day moving average and is on the verge of breaking out of a 10-month-long downtrend line (thick grey line in chart). Moving averages are curling up. The metal may pull back some as it is overbought on a daily basis, otherwise looks good. Net longs currently 130.2k, up 8k.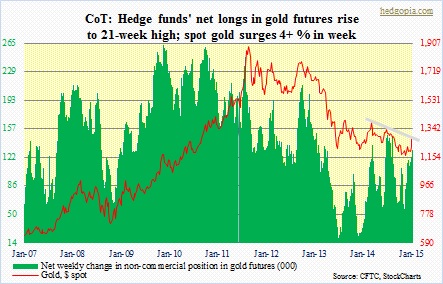
Nasdaq 100 index (mini): Last time they were net short was November 2012. These traders have consistently maintained net long exposure, even though have been cutting back for five weeks now. On Friday, the Nasdaq 100 managed to save crucial support. Odds are decent that bulls will be able to build on that. Near-term, technicals are oversold. Currently net long 37.7k, down 10.6k.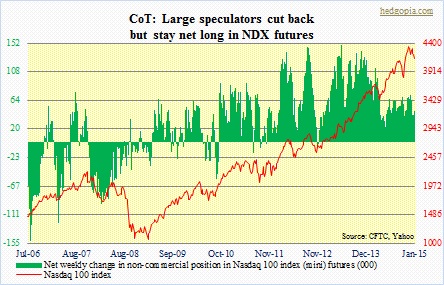
Russell 2000 mini-index: Net shorts are substantially down from 73k in September last year. Nonetheless it is interesting to see them add this week even though the Russell 2000 hovers near all-time highs. Bulls were able to save the 200-day moving average on Friday. Currently net short 26.6k, up 5.1k.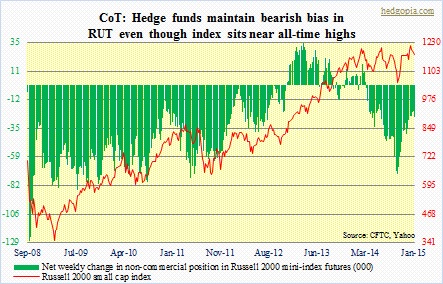
U.S. Dollar Index: Yet another high. Net longs are the highest ever. These traders have gotten the direction of the dollar so right – have been consistently adding since the middle of June. The index is at 11-year high, and has been up for six consecutive months. If January ends in the green, that would make it seven, which will be the first time going back to at least 1995. One crowded trade! Currently net long 72k, up 2.2k.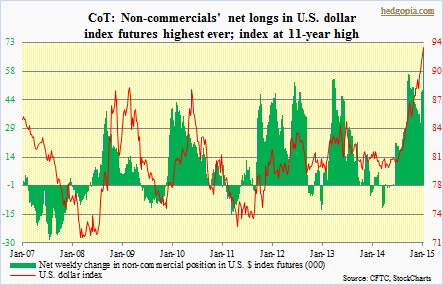
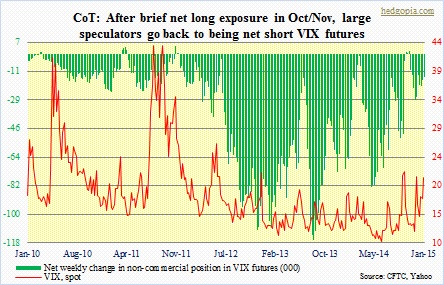
VIX: After a brief net long exposure lasting three weeks ended early November, they have been net short the past 10 weeks. Notice the green bars which since August 2013 have been persistently making higher lows, even as the spot is more or less flattish. In the near-term, the VIX is probably headed lower. Currently net short 14.2k, down 1.8k.