Bulls are snorting – again. From the Boxing day bottom, the S&P 500 is up 14 percent. Last week, it recaptured 2630 as well as the 50-day. While healthy, the rally has come too far, too fast.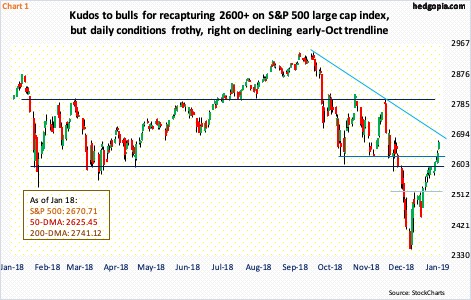
Equity bulls deserve kudos. They suffered quite a rout in October-December but have put up a healthy countertrend rally in the past four weeks. Since bottoming intraday at 2346.58 on December 26, the S&P 500 large cap index (2670.71) rallied 14 percent.
In so doing, the index has reentered the rectangle it was in for most of last year. Since late January last year, the S&P 500 played ping pong between 2800 and 2600. The latter was lost mid-December, followed by acceleration in selling (Chart 1). During the October-December selloff, both the 50- and 200-day moving averages, in addition to tons of other support, were lost.
Last week, the index retook the 50-day (2625.45), as well as support-turned-resistance at 2600-2630. It is possible stops got taken out; the index jumped 2.9 percent last week – fourth straight weekly increase. The S&P 500 now finds itself right at a declining trend line from early October, when it started to unravel.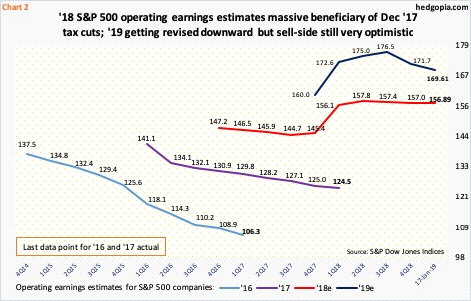
From early October through late December, the S&P 500 fell just north of 20 percent. Since that low, it has recouped half of that loss. Low earnings bar helped.
Post-tax cuts of December 2017, EPS estimates jumped. On December 21 that year, 4Q18 operating earnings estimates for S&P 500 companies were $38.41. By mid-August last year, they rose to $42.40. Then the sell-side took out its scissors. When 4Q ended, they had lowered them to $40.42 – just in time for companies to meet/beat. With 13.4 percent of the reports in, these companies have earned $40.32.
More importantly perhaps, the downward revision trend in 2019 estimates continues. Early August last year, the sell-side expected as much as $177.13 this year. At the time, they expected 2019 earnings to grow 12.2 percent. As of last Thursday, these companies are now forecast to earn $169.61 this year. This still represents 8.1-percent growth. This follows a 26-percent surge in 2018, which benefited from the afore-mentioned tax cuts.
In a scenario in which 2019 estimates continue lower – which is looking probable – bulls should continue to struggle to make the valuation argument. The operating P/E on 2019 earnings currently stands at 15.8x – not cheap by any stretch of the imagination.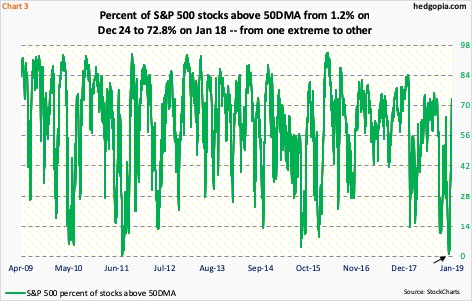
The 300-plus point rally in the past three weeks has pushed momentum indicators into extremely overbought territory. The daily in particular is way extended. Several metrics have gone from one extreme to the other.
The percent of S&P 500 stocks above the 50-day was a mere 1.2 percent on Christmas Eve (arrow in Chart 3), which was the lowest since August 2011. It then went vertical. Last Friday, 72.8 percent of stocks were above that average.
In the right circumstances for bulls, this metric can still push higher – toward high-70s/low-80s – before it gets egregiously overbought.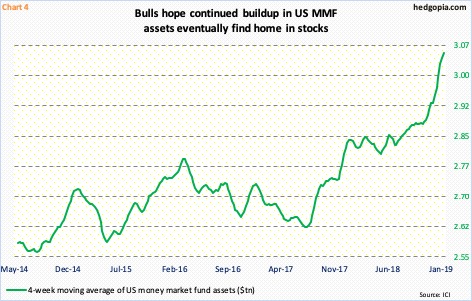
This much we know.
If the three-week rally is the beginning of something big, then we should soon begin to get this reflected in several other data points. For whatever it is worth, on December 26 and January 4, NYSE up volume made up more than 95 percent. This is potentially bullish, but to build on this breadth thrust, bulls need money-market funds to cooperate.
As of Wednesday last week, ICI data shows, money-market fund assets declined $17.4 billion week-over-week to $3.05 trillion. This was the first weekly drop in six weeks. Since the week ended October 3, these assets are still up $178.4 billion. The four-week average has continued higher (Chart 4). That is a lot of dry powder – potential, of course.
That said, in the week to last Wednesday, as per Lipper, $4.4 billion came out of US-based equity funds. (Lipper shows a $15-billion drop in money-market funds.)
Unless stocks are able to attract at least some of these funds, there is plenty of room to doubt the sustainability of the recent move. If it is genuine, as the S&P comes under pressure, there should be bids waiting at 2600-2630.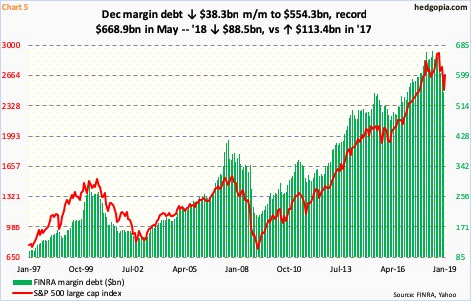
How margin debt behaves will be another signal.
In December, FINRA Margin debt declined $38.3 billion month-over-month to $554.3 billion – understandable considering stocks took a hit in that month. Margin debt reached an all-time high of $668.9 billion in May last year, which was not that far away from January’s prior high of $665.7 billion.
Altogether, margin debt collapsed $88.5 billion last year. This contrasts with a $113.4-billion surge in 2017. In 2018, the S&P 500 fell 6.2 percent, versus a 19.4 percent jump in 2017.
More often than not, the red line and the green bars in Chart 5 tend to move in tandem. The two prior peaks were in 2000 and 2007. January-to-date, the S&P 500 is up 6.5 percent. If past is prologue, this should accompany a rise in margin debt. We will find out when January’s numbers are reported. A lack thereof will raise a yellow flag. The risk here is that margin debt remains at an elevated level. There is a lot to go on the downside once serious unwinding begins.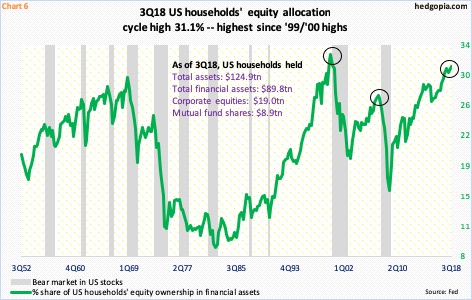
The same is true with Chart 6, which shows US households’ equity allocation. In 3Q18, it was 31.1 percent, which is already much higher than the 2Q07 peak of 27.5 percent. The all-time high was recorded in 1Q00 at 32.6 percent. We know how the prior two peaks ended.
In the past, once the green line in the chart earnestly begins to come under pressure, a bear market follows. This is a medium- to longer-term risk. Near term, bulls’ best hope, as indicated above, is that there will be buyers waiting when 2600-2630 on the S&P 500 is tested. If this level is breached, the downside risk is 2520 (Chart 1). This should at least neutralize some of the froth that is in the price currently.
Thanks for reading!

