
After peaking in March and dropping in mid- to-high single-digit percent, the major US equity indices have rallied the last two weeks, ending last week right on the 50-day. A takeout of the average, which was lost three weeks ago, is likely but a sustained move higher is unlikely as overhead resistance is galore.

From the March 28th peak of 5265, the S&P 500 gave back 5.9 percent through the April 19th low of 4954. From that low, the large cap index rallied nicely to test the 50-day last Monday but was rejected. This was an opportunity for equity bears to press, which they did, managing to exert downward pressure last Tuesday and Wednesday. The downward momentum even continued early Thursday, with the index down 1.7 percent for the week through the session low of 5011, which got bought. By Friday, momentum had completely swung the other way, as the session gapped up to tick 5139 intraday but close the week at 5128, up 0.6 percent for the week and essentially right at the 50-day (5129).
It is likely the average – currently flat – gets taken out this week. As a matter of fact, Friday’s 1.3-percent jump helped the index push through a falling trendline from the March 28th high. But there are other levels where selling is likely to pick up. Since the April 19th low, the index has traded within a rising channel; Last Friday’s high just about touched the upper end. It is entirely possible the index continues higher all along the rising channel, which in due course will then line up with horizontal resistance at 5170s (Chart 1).
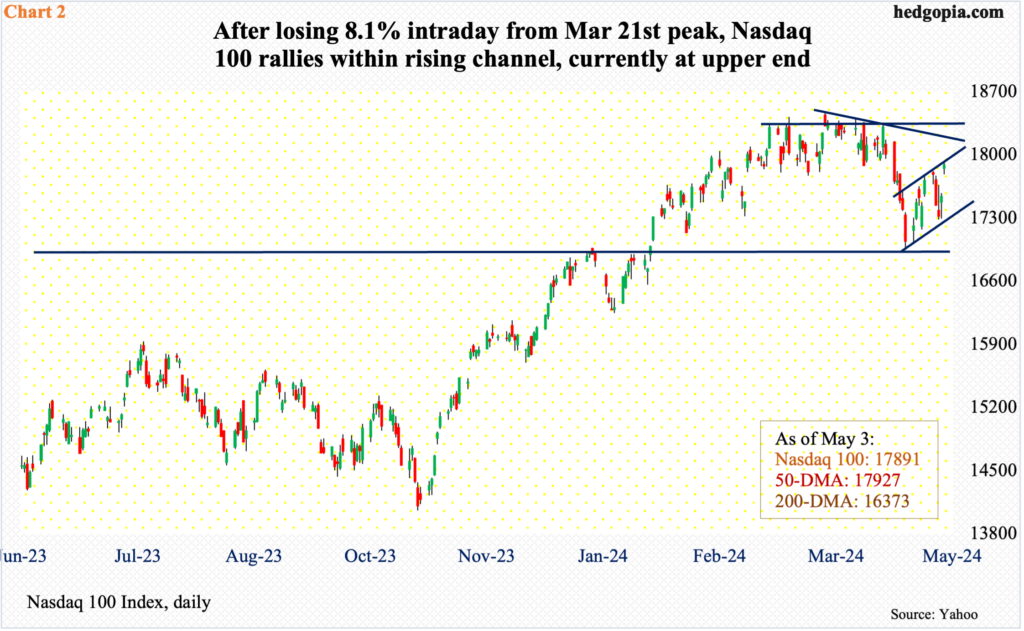
Things have evolved similarly on the Nasdaq 100, which between the March 21st peak of 18465 and the April 19th low of 16974, dropped 8.1 percent. Last week, it closed at 17891, with the tech-heavy index touching the 50-day (17927) intraday. The index has been under the average for 15 sessions now – which is also the case with the S&P 500. The average is also flat on the Nasdaq 100.
As is the case with the S&P 500, the Nasdaq 100 has traded within a rising channel since last month’s low; last week’s one-percent rally brought the index right to the upper end. Should it manage to break out, there is no shortage of levels overhead where tech bears are likely to get more aggressive.
At 18100 lies trendline resistance from the March 21st high. Then, there is 18300s, which the Nasdaq 100 failed to decisively break out of several times over seven weeks beginning March 1st (Chart 2).
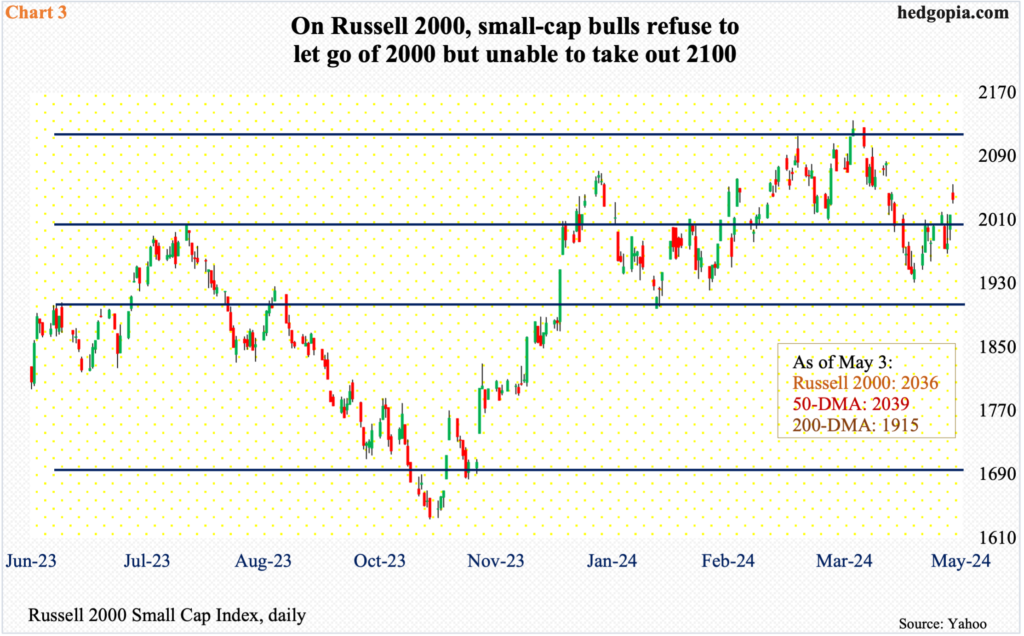
The story is different in the small-cap arena, not the least because the Russell 2000 remains way under its November 2021 peak of 2459. Last week, it closed at 2036, having rallied as high as 2135 on March 28th (Chart 3).
Earlier, after peaking in 2021, the small cap index touched 1641 in June 2022 and 1642 in October that year. These lows were successfully tested last October as the index ticked 1634 before reversing higher.
A 61.8-percent Fibonacci retracement of the peak-to-trough drop comes to 2144. After losing the level in January 2022, the index has found stiff resistance at 2100, which also represents a measured-move price target post-breakout at 1900 last December. Before that, the Russell 2000 essentially played ping pong between 1700 and 1900 going back to January 2022.
Until 2100 gives way, small-cap bulls get no bragging rights. Ditto with the bears who need to at least push the index below 2000 to build some momentum. For now, the Russell 2000 is in no man’s land. And, as is the case with its large-cap cousins, it ended last week right on its 50-day. It did gap up to rally one percent last Friday, but ended the session in a weak note, as it was up as much as 1.9 percent at the session high.
On each of the three indices, the 50-day is flat. Unless the bulls get their act together – and quick – the average could very well be looking to turn down.
Thanks for reading!
