
Small-caps have spring in their step – so to speak – but major resistance is holding firm.
In a month through Tuesday’s six-month high of $160.46, IWM (iShares Russell 2000 ETF) jumped 10.7 percent. But bulls probably are not too delighted with the way the ETF ($158.23) behaved in that session, which ended up forming a shooting star. More important is where it showed up.
With two sessions to go this week, IWM is essentially unchanged – up 0.1 percent. This preceded four straight up weeks, having bottomed on October 3 at $144.93. Back then, bulls showed up at two-year horizontal support at $144.50-145. This was a battle won. They would have won a war should $160 fall. This resistance goes back to January last year and has been a persistent source of sell orders, particularly since February this year (chart below).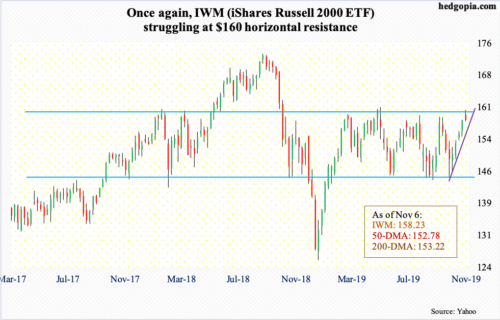
Using a measured-move pattern, a breakout likely opens the door to a test of IWM’s all-time high from August last year, when it peaked at $173.39. But the problem is that a lot of buying power has been expended over the past month. Things are overbought – daily in particular and weekly getting there – with the daily RSI almost hitting 70 percent on Tuesday.
This raises the odds of at least some level of unwinding near term. How bulls defend support zones will be a big tell. Immediately ahead, around $157.50 lies trend-line support from early last month. Then come shorter-term moving averages, which will then be followed by both the 50- and 200-day.
Thanks for reading!
