
After dropping by low double digits from their February all-time highs, the major large-cap equity indices are showing signs of a bottom – duration and magnitude notwithstanding.
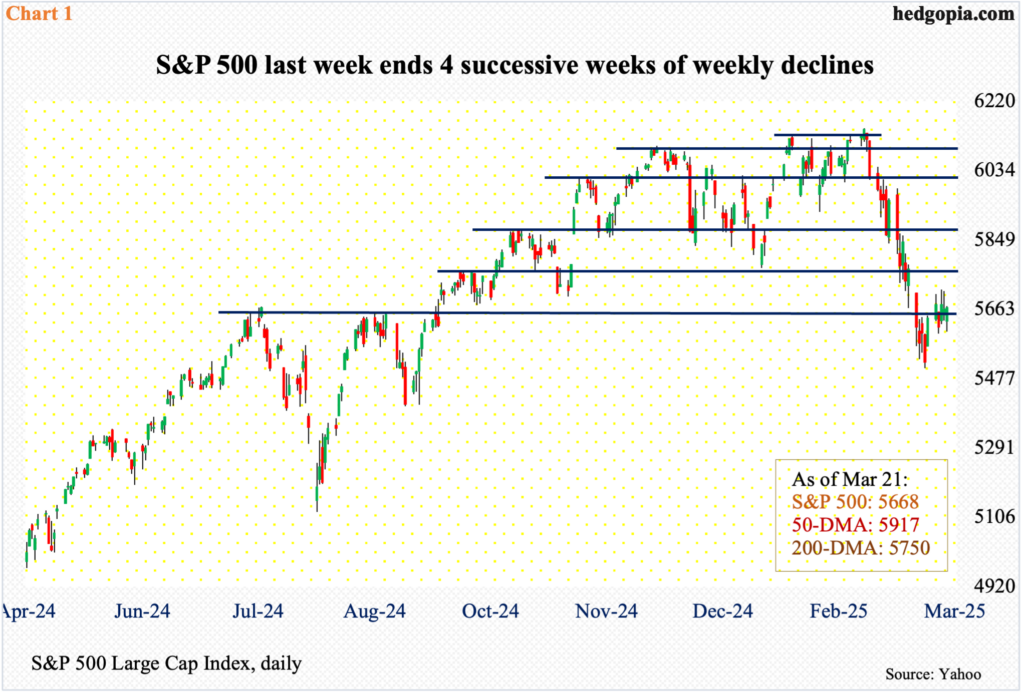
Between February 19th when the S&P 500 reached a fresh intraday high of 6147 and March 13th when it bottomed at 5505, the large cap index tumbled 10.5 percent. In the next six sessions since reaching that low, trading has pretty much gone sideways at a slightly higher level. Having come after such a sharp, three-week drop, this consolidation should be viewed positively.
Last week, the S&P 500 rose 0.5 percent to 5668. This was the first up week in five – closing right at 5660s resistance (Chart 1). Once this hurdle yields, the next layer of resistance is likely to come from the 200-day moving average at 5750, which just about lines up with horizontal resistance at 5770s. This is in the near-term.
Mid- to long-term, a rising trendline from October 2023 was breached three weeks ago, and it does not get tested until north of 6050s. This is a ways off. Before the bulls could test and find out how real that breakdown was, they have to first win back several other price points that have been lost during the selloff – such as 5860s and 6000, with the 50-day at 5917.
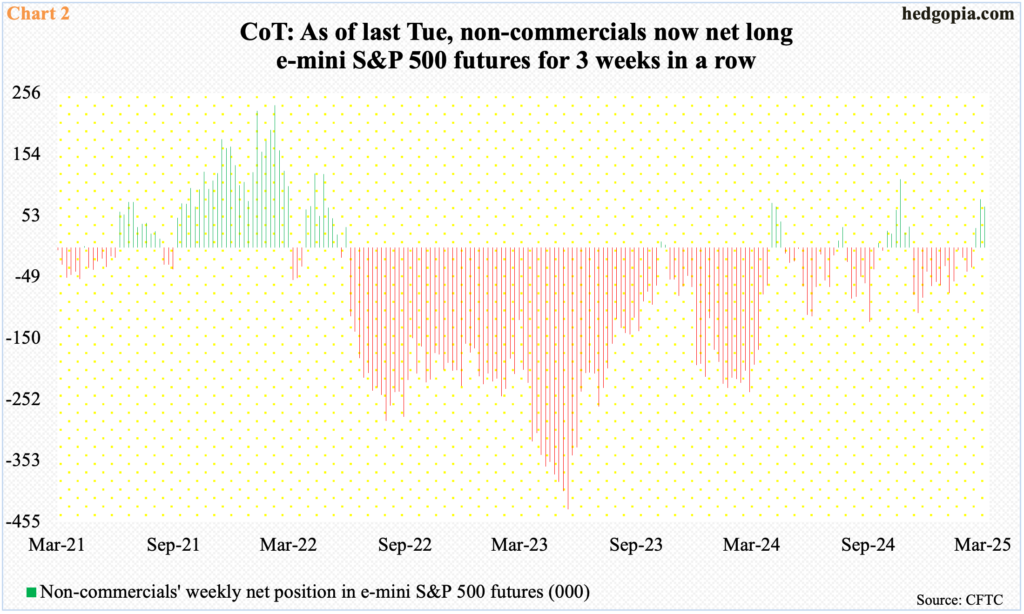
If the expected rally materializes, non-commercials, who just ditched their bearish bias, are well-positioned.
As of last Tuesday, they were net long 68,311 contracts in e-mini S&P 500 futures. This is slightly lower than the prior week’s holdings of 80,613 net longs, which was an 18-week high. Nevertheless, they have now been net long for three successive weeks, and the last time they had a long bias was in the week to November 24th last year (Chart 2).
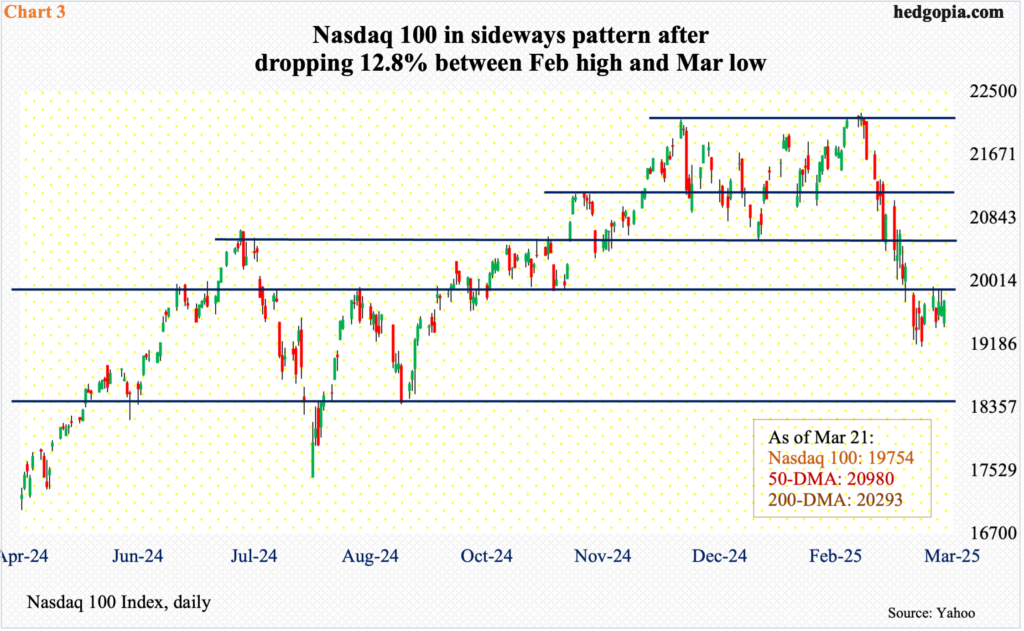
Over at the Nasdaq 100, which dropped 12.8 percent from the February 18th all-time high of 22223 to the March 13th low of 19153, there are similar signs of wanting to go higher at least in the near term.
In the week the six-month low was set on the 13th, a bullish hammer reversal developed on the weekly. This was then followed by last week’s spinning top.
Last week, the tech-heavy index inched up 0.25 percent to 19754. Immediately ahead rests the 200-day at 20293. Then comes horizontal resistance at 20500s, which the bulls failed to defend as soon as trading began this month (Chart 3).
Both these indices in the large-cap arena act as if they are itching to move higher. Concurrently, what happens in small-caps is equally important.
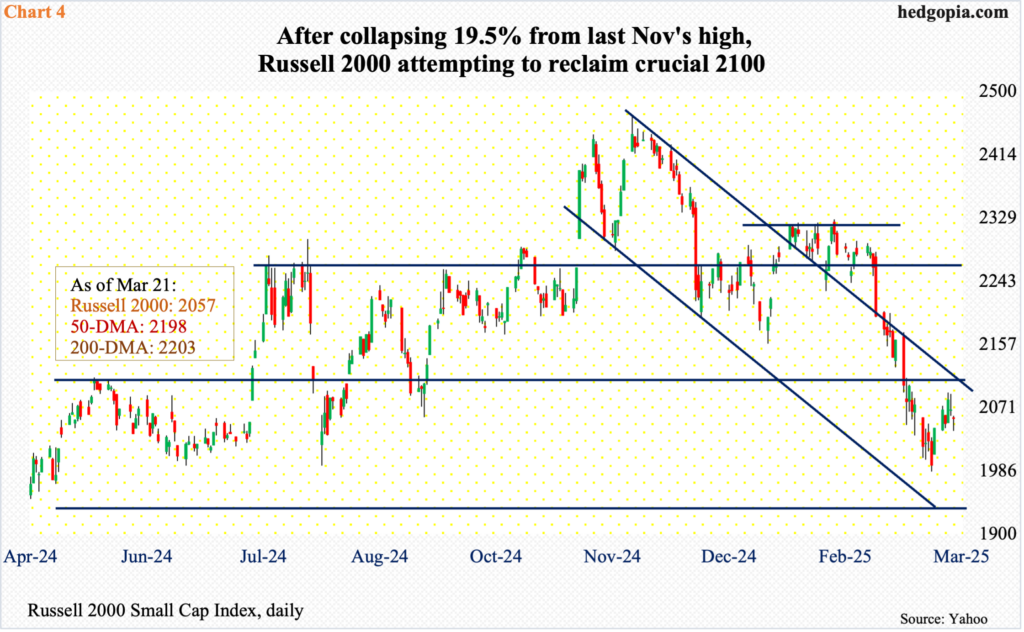
Small-cap bulls have their backs against the wall since November 25th last year when the Russell 2000 posted a new all-time high of 2466 – just past the prior high of 2459 from November 2021 – before reversing hard lower. By the 13th this month, it had collapsed 19.5 percent to 1985.
Since that low, bids have shown up, but only cautiously. The small cap index remains under 2100, which it broke out of last July, followed by a successful retest in September. This time around, the retest was unsuccessful (Chart 4). From the bulls’ perspective, the sooner it is reclaimed, the better. There were two attempts last week, with Wednesday ticking 2092 and Thursday 2090, closing the week up 0.6 percent to 2057. There will be more attempts in the sessions ahead for sure. A success can set in motion a risk-on attitude, which then will also help the large-caps.
In the event 2100 is reclaimed, the Russell 2000 probably has an easy path toward 2200, where the 50- and 200-day converge (2198 and 2203 respectively).
Thanks for reading!
