
Rising interest rates, geopolitical tensions and inflation worry, among others, are not making a dent in stocks – not yet anyway. Dips are persistently getting bought. Last week, the major US equity indices finished in such a manner that a minor breakout looks imminent.
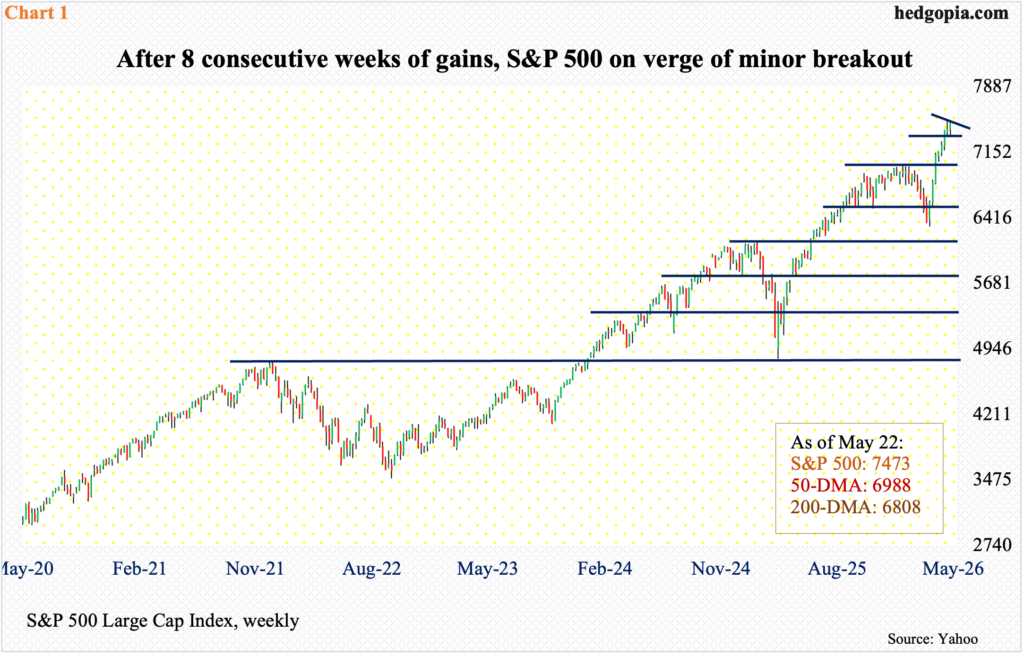
On the 14th this month, the S&P 500 posted a fresh intraday all-time high of 7517 before coming under pressure for a 2.4-percent drop through last Tuesday’s session low 7334. The subsequent rally brought the large cap index within less than 11 points of that high last Friday; a sharp reversal lower from Friday’s session high 7506 helped form a daily shooting star, which can be interpreted as potentially bearish in the near term. That said, the way the index has traded the last two weeks, bulls do have an opportunity now for a minor breakout (Chart 1).
Leading up to this, the S&P 500 has had eight weeks of gains in a row. On March 30, it bottomed at 6317, then rallying 19 percent. Last week, the index rose 0.9 percent to 7473. If a breakout occurs this week and the momentum sustains, the already overbought condition that the index finds itself in will have been extended further.
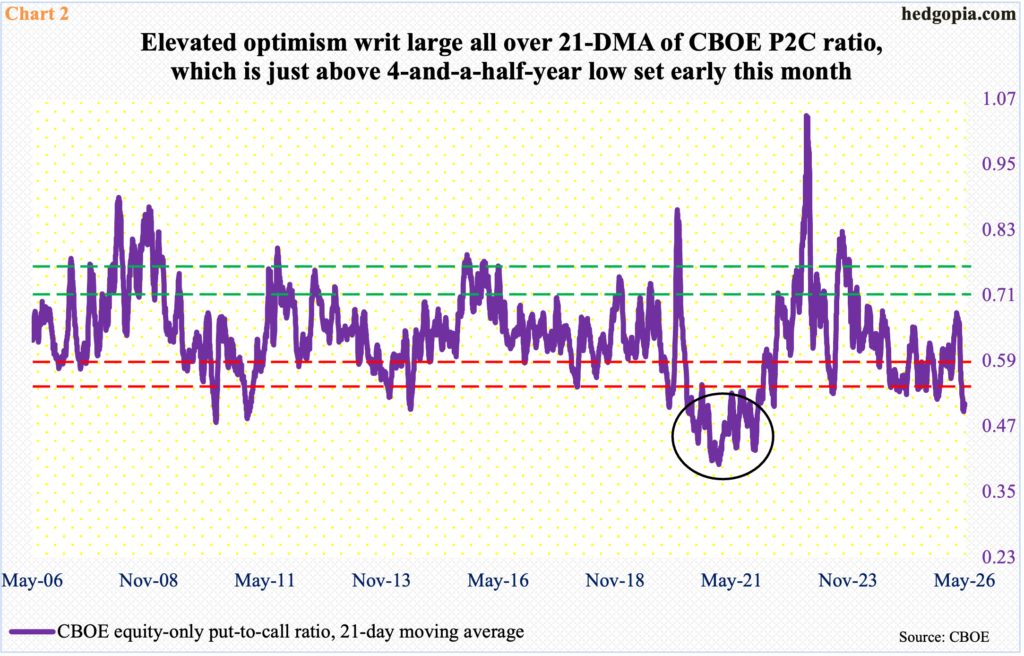
Nowhere is this more evident than in the options market.
The CBOE equity-only put-to-call ratio has produced readings of 0.50s or lower, for 33 consecutive sessions, with 14 of them in the 0.40s. The 21-day moving average of the ratio finished last week at 0.51, just slightly higher than four consecutive readings of high-0.40s in the prior week; readings have not been this low since December 2021.
In the right circumstances for equity bulls, these conditions can continue to remain elevated. Back then, in the wake of the Covid-19 bottom in March 2020, the S&P 500 did not peak until January 2022. In the intervening period, there were many sessions in which the straight put-to-call ratio produced readings of 0.30s, with the 21-day average remaining in the 0.40s for an extended period (black oval in Chart 2). This time around, there has not been a single reading in the 0.30s.
Sentiment reflected in options already borders on froth, but frothy can always get frothier.
Tech bulls are hoping for exactly that.
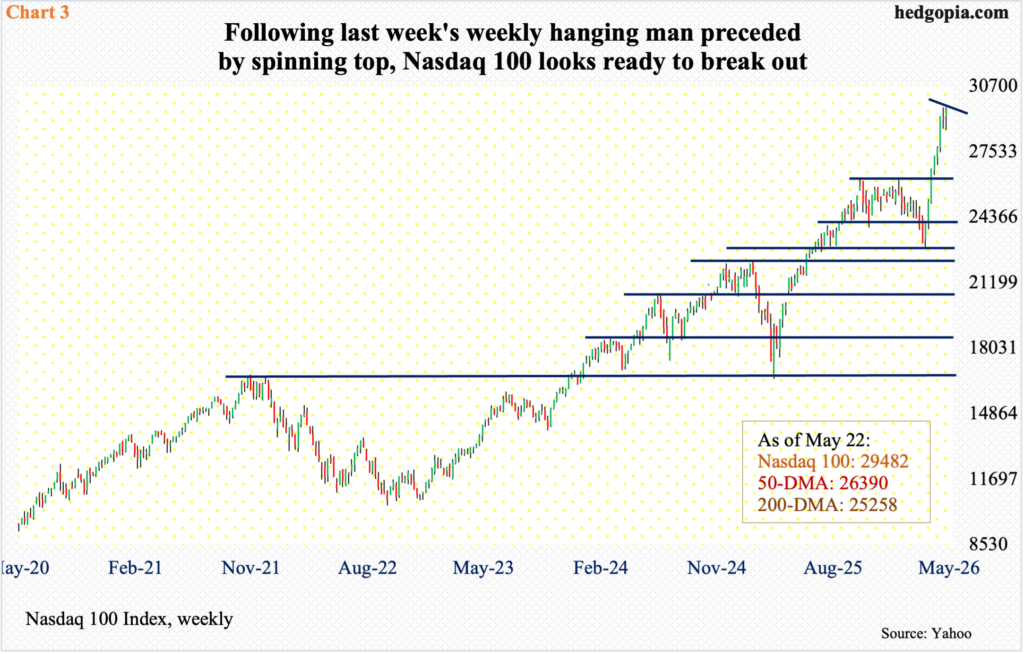
Like the S&P 500, the Nasdaq 100, too, produced a daily shooting star last Friday, as the session high 29664 was merely 15 points short of the all-time high of 29679 from the 14th before sellers showed up, closing the week up 1.2 percent to 29482. In the end, the weekly ended with a hanging man, coming on the heels of a spinning top in the previous week. These candles, having shown up after a 29.9-percent jump from the March 30 low, can create problems for the bulls, but they need confirmation.
As things stand, tech bulls have an opportunity to deny the bears of any opportunity to press their case by breaking out of two-week resistance (Chart 3).
In the past, shorts have come to bulls’ rescue many a time.
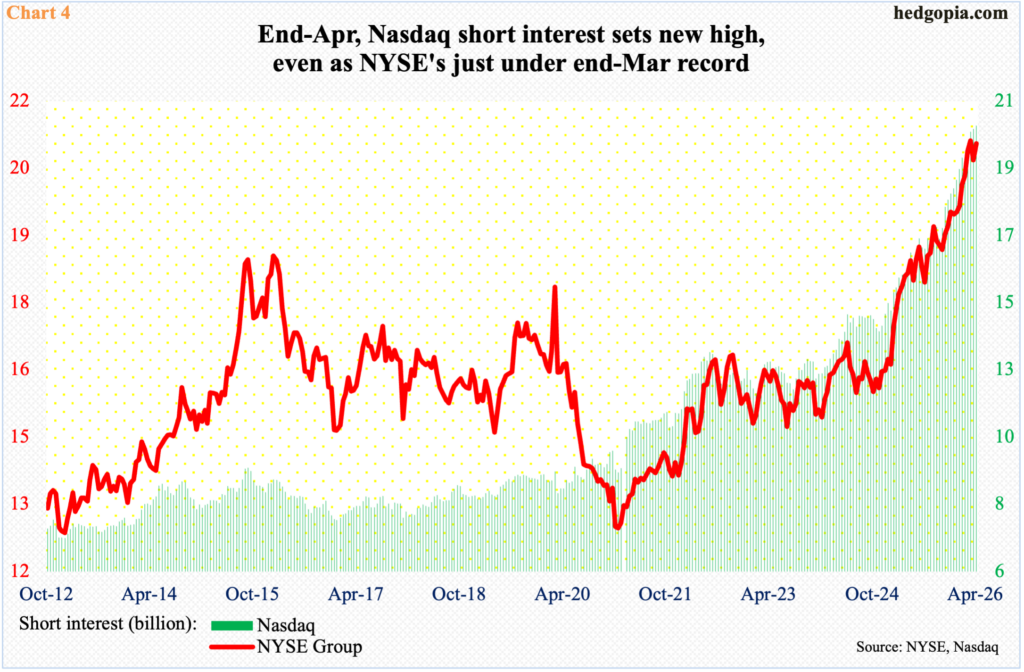
In the current cycle, there has been no shortage of issues for shorts to latch on to and build bearish positions, which they have been doing for months. The major equity indices reached major lows in April last year; at the end of July, NYSE and Nasdaq short interest both began rising, and they kept rising, even as equities – barring a two-month slide through March this year – kept marching higher. Shorts, although hurt, have kept at it.
At the end of April, Nasdaq short interest stood at 20.6 billion – a record; NYSE’s was 20.8 billion, which was just under record 20.9 billion from March-end (Chart 4). Unless the bottom falls out of equities in a crash or something, the elevated level of short interest can cushion the blows of downward pressure, as shorts rush to cover. (Mid-May readings are due out tomorrow.)
Although options are reflecting a complacent behavior, equity bulls’ advantage in the current set-up is that investor sentiment is yet to reach dangerously elevated levels.
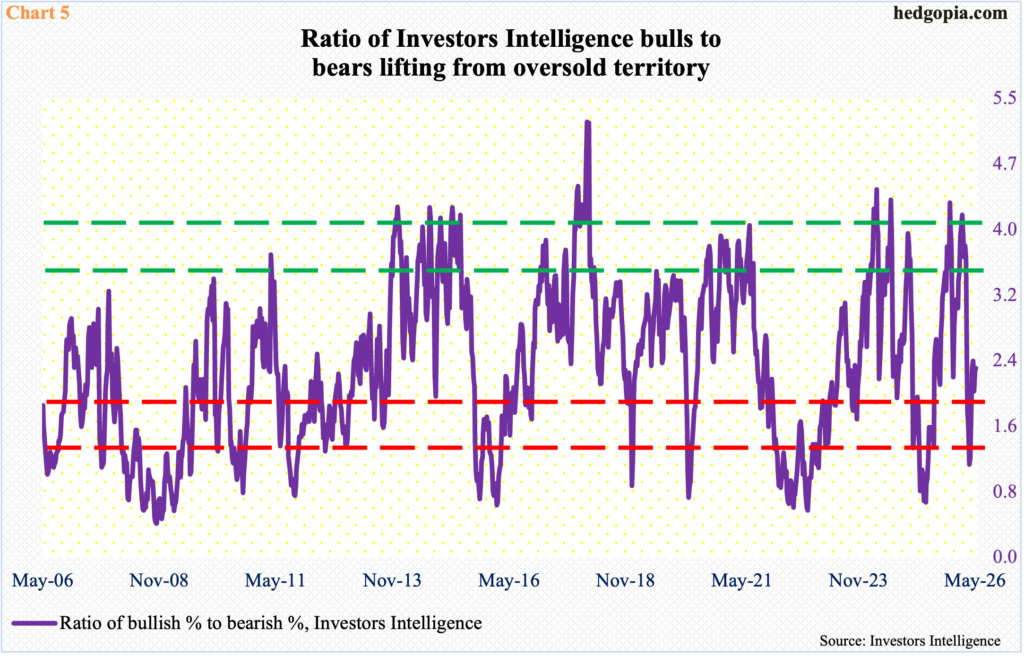
As of last Tuesday, Investors Intelligence’s bullish percent dropped 2.8 percentage points week over week to 48.1 percent, matching a low from a month ago; the bearish percent, in the meantime, declined 1.6 percentage points w/w to 21.1 percent. Accordingly, the bulls-bears ratio was 2.3 last week, up from a low of 1.1 at the end of March but nowhere near the 4.1 from early February, when bulls crossed 62 percent.
The ratio is rising but is some distance away from reaching the extended zone in Chart 5. This can be a sign that, despite the massive rally the indices have enjoyed the past couple of months, there is buying power left still. The latest sentiment numbers will be published later today.
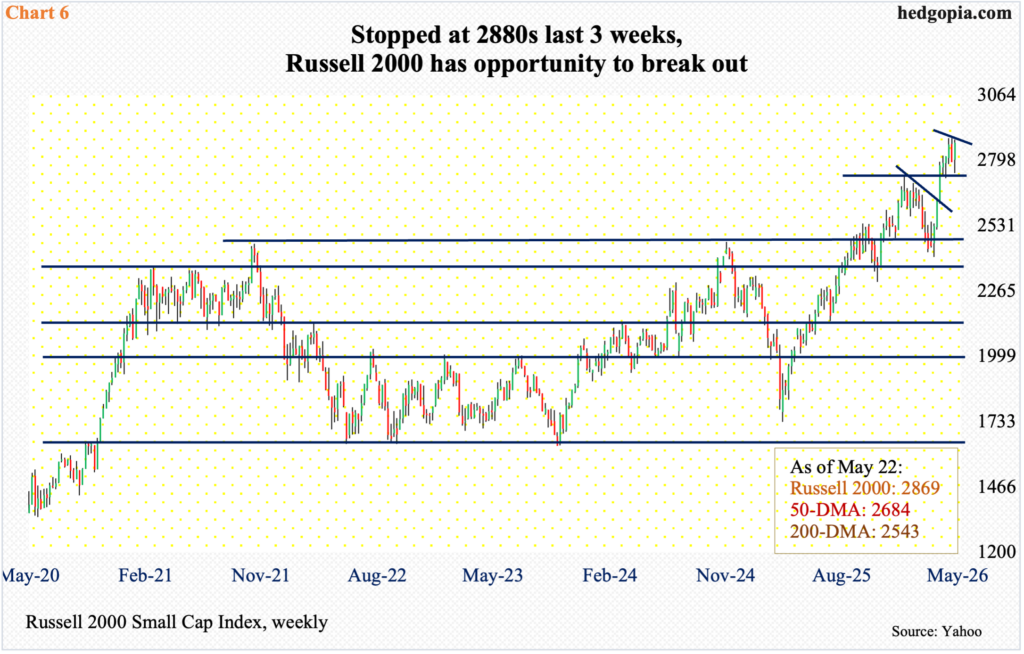
Sentiment-wise, small-caps, which are widely viewed as a barometer for risk-on, are yet to meaningfully live up to their expectations. The Russell 2000, which bottomed on March 30 at 2405, rallied 20.1 percent through the fresh all-time high of 2889 posted on the 6th this month. Since then, the small cap index has posted lower highs – 2888 on the 11th and 2883 last Friday (Chart 6). Last week, it rose 2.7 percent to 2869.
So, the bears, for three weeks now, have successfully stopped the bulls at 2880s. The latter, of course, successfully managed to chart out a breakout retest at 2735, which was first hit on January 27, followed by a two-month decline, and reclaimed six weeks ago; last Tuesday’s low 2747 was bought, and this was preceded by a similar retest four weeks ago. This gives the bulls an opportunity to break out of three-week trendline resistance.
Thanks for reading!
