
After a rough two-week selloff, major US equity indices last week saw both bulls and bears try to put their foot down. The former put up a good show early in the week but the latter grabbed the first opportunity offered.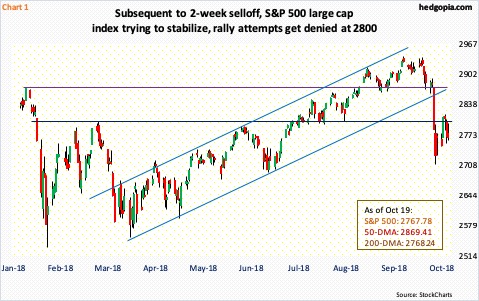
Between the 3rd and 11th this month, the S&P 500 large cap index declined 7.8 percent intraday. That is in seven sessions! In the process, it sliced through a rising channel as well as both the 50- and 200-day moving averages. Importantly, horizontal support at 2800 was lost. With the kind of technical damage all this wrought, it would only make sense if things took time to stabilize.
Shorts have tasted blood, and would conceivably try to get active at the right opportunity, which they did last week. On the S&P 500 (2767.78), resistance at 2800 held (dark blue horizontal line in Chart 1). This area also represents the underside of a broken February 2016 rising trend line.
Bulls for their part were unable to build on Tuesday’s huge rally, as they faced eager sellers/shorts at the 10-day. That said, the low of seven sessions ago stands. After having lost it earlier, they also managed to recapture the 200-day, with the week closing right on it. In short, both bulls and bears held on to their ground last week.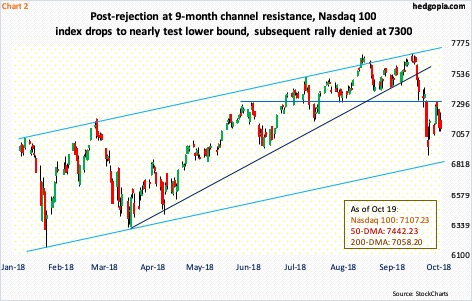
Such bull-bear dynamics were also seen on other indices.
Tuesday, the Nasdaq 100 index (7107.23) rallied strongly off of the 200-day, only to get repelled at 7300, a significant area the past four months. The support was obviously lost during the latest selloff, when the index lost 10.5 percent intraday in nine sessions. Also lost was both the 50- and 200-day. The latter was later retaken.
The Nasdaq 100 has essentially been trading within an ascending channel the past nine months. The October 1st all-time high of 7700.56 once again kissed the upper bound of the channel. In the subsequent decline, trend-line support from April was gone. From bulls’ perspective, the good thing is that the October 11th low of 6892.89 just about tagged the lower bound of the channel. In other words, bulls defended what they must have. In the same way, bears got aggressive last week when they were offered an opportunity.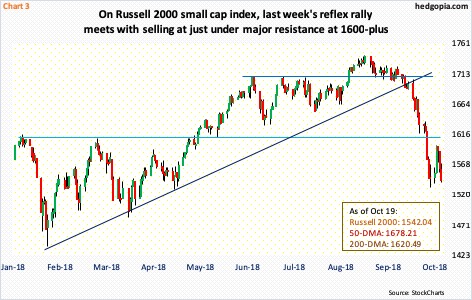
The story is the same on the Russell 2000 small cap index. It peaked much earlier than other indices did, and sustained the most damage in the selloff. The index peaked at 1742.09 intraday on August 31, then dropped all the way to 1530.98 by the 12th this month. During the 12.1-percent mini-collapse, it sliced through a rising trend line from February 2016, lost major horizontal support at 1610-ish as well as both the 50- and 200-day.
The May break out of 1600-plus was an important development. Using a measured-move approach, a technician would eye 1780s as a target. The index (1542.04) did rise to 1740s, before gradually falling apart. Last week’s rally was stopped at just short of 1600 (Chart 3). Small-cap bulls cannot afford to lose support at 1515-1530. Friday last week, the index fell to 1530.98 intraday before bids showed up for a long-legged doji session.
Hence the significance near term of recent lows on all these three indices. Bulls’ mettle will be tested around these levels. In this scenario, the daily in particular further gets into oversold territory. Odds favor a test – or even a slight breach – gets bought for a reflex rally. Will this be enough to ultimately recapture all the lost support, time will tell?
Thanks for reading!
