
Investor sentiment has taken a hit, but major US equity indices are hanging in there – on a relative basis. This is a medium- to long-term worry for bulls. Near-term, they could be looking for opportunities. Possible catalysts include Thursday’s CPI report and next week’s FOMC meeting.
Investor sentiment is subdued.
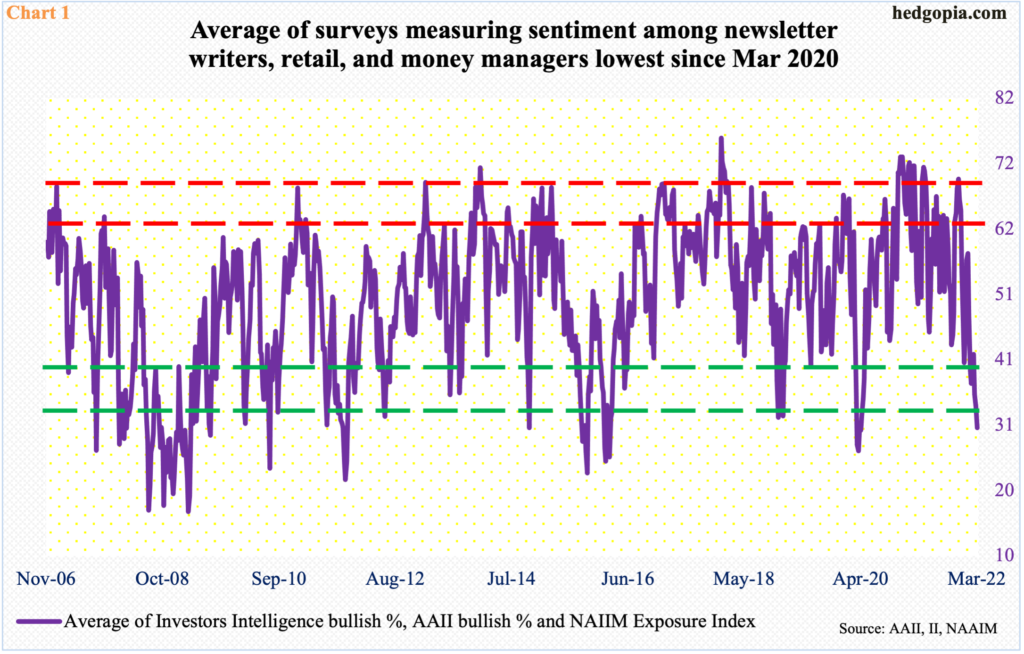
Last week, AAII (American Association of Individual Investors) bullish percent rose seven percentage points week-over-week to 30.4 percent; two weeks before that, their count was 19.4 percent, which was the lowest reading since May 2016. This survey focuses on individual investors.
Bulls in the Investors Intelligence survey, which polls newsletter writers, were similarly defensive. Their count last week dropped 2.3 percentage points w/w to 29.9 percent.
Along the same lines, the NAAIM Exposure Index, which represents the average exposure of its members to US equity markets, declined 14.1 points w/w last week to 30.3. This was the lowest reading since April 2020; a month before that in March, the index dropped as low as 10.7. This survey is conducted by the National Association of Active Investment Managers among, as the name suggests, its members which manage money themselves.
Chart 1 combines all these three surveys and takes an average, which last week fell to the lowest since March 2020; back then, the metric remained in the mid- to high-20s for four consecutive weeks before reversing higher.
Sentiment is low enough even a modicum of good news –real or perceived – can cause a relief rally. That said, the drop in sentiment is not matched by major US equity indices which have come under pressure but in an orderly fashion. In the past, when sentiment was as low, stocks took a bigger hit.
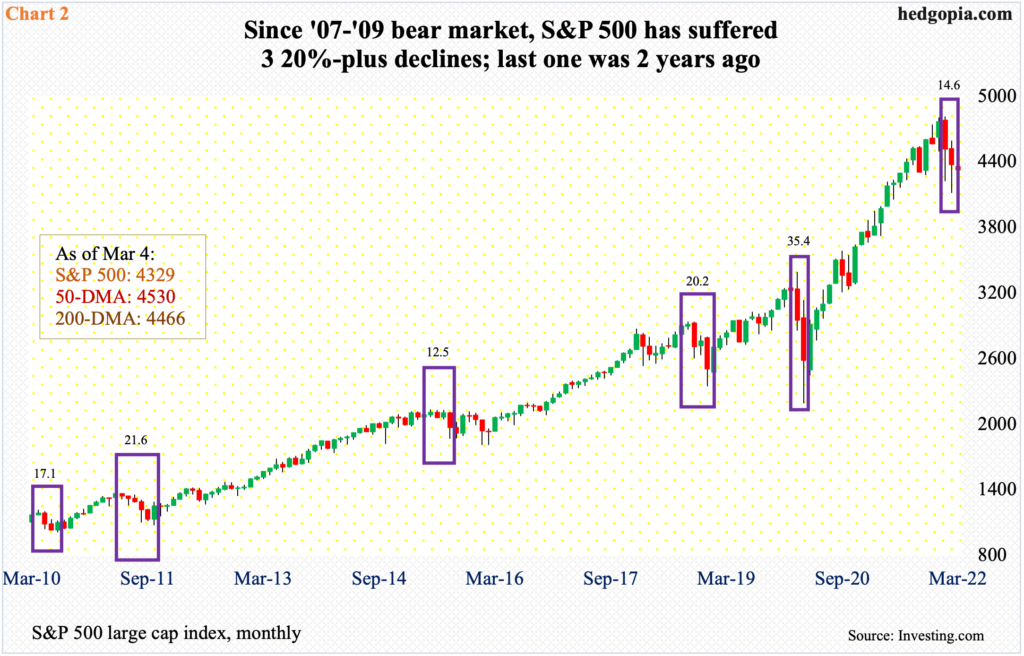
Since the severe bear market during the financial crisis of 2007-2009, there have been three 20-plus-percent drops in the S&P 500, with two other decent drops (boxes in Chart 2).
In February-March 2020, the index dropped 35.4 percent; in the week to March 24 back then, which is when the S&P 500 bottomed, Investors Intelligence bulls bottomed at 30.1 percent. This week, as previously mentioned, bulls were 29.9 percent, and from its January 4 high of 4819 through the February 24 low of 4115 the S&P 500 (4329) lost 14.6 percent.
In September-December 2018, the index dropped 20.2 percent, with Investors Intelligence bulls bottoming at 29.9 percent. Between May and August 2015, the large cap index dropped 12.5 percent, but bulls slid as low as 24.7 percent. Between May and October 2011, the index fell 21.6 percent; bulls’ lowest count was 34.4 percent back then. Between April and July 2010, the S&P 500 declined 17.1 percent, even as bulls’ count fell as low as 32.6 percent but proceeded to drop to 29.4 percent early September.
The point is, there is obviously no magic formula to all this. What is certain is that the odds of a rally rise once sentiment drops to oversold territory, which is the case now.
This week, Ukraine should continue to hog the headlines. Then on Thursday, February’s consumer price index will be published. This will be the last major inflation report before the FOMC meets next week on 15-16.
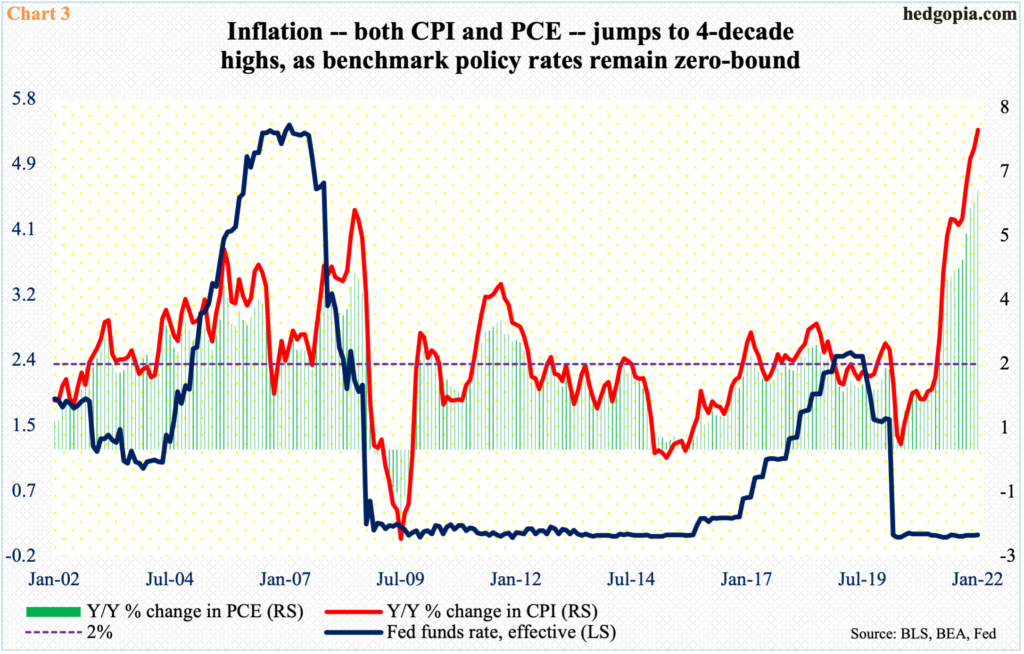
Inflation has gone vertical in the last couple of years. On a year-over-over basis, the PCE (personal consumption expenditures) bottomed at 0.4 percent in April 2020 and the CPI at 0.1 percent in the following month. This January, they respectively grew 6.1 percent and 7.5 percent, which was the steepest price rise since February 1982 – a four-decade high (Chart 3).
In the meantime, the fed funds rate remains zero-bound. Jerome Powell, Federal Reserve chair, told Congress last week that he expects a quarter-point hike next week.
He, and his team, have their backs against the wall. The Ukraine situation has thrown them a curve ball. Commodities have gone through the roof, which has the potential to not only exacerbate inflation further but also adversely impact global growth.
Behind the curve, the Fed will be tightening in a slower growth environment. It is a real predicament – let inflation run hotter and save growth or go after inflation at the expense of growth.
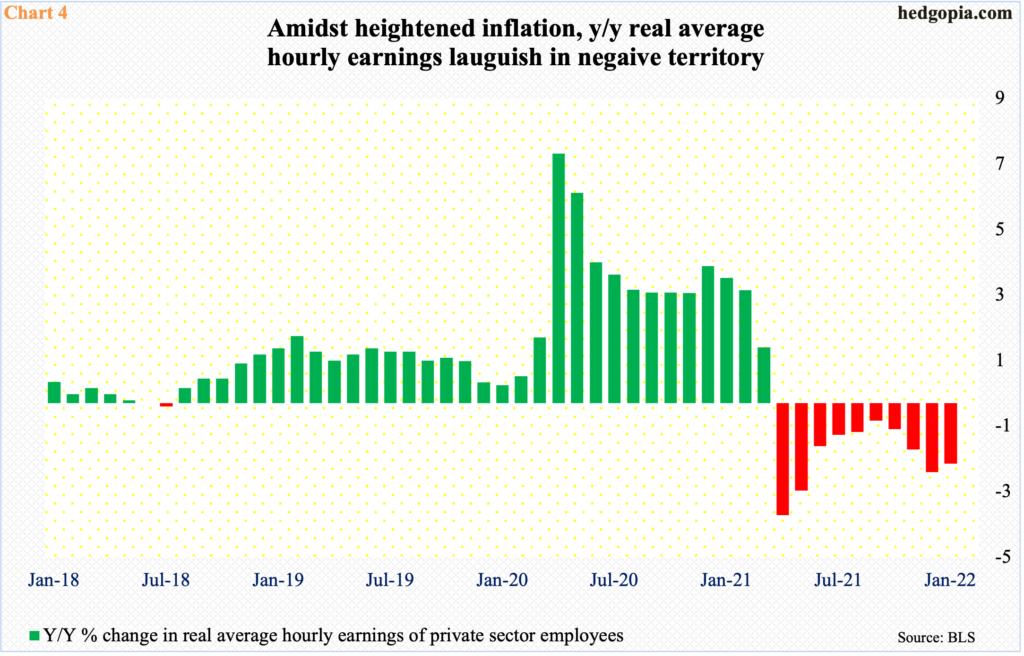
Because the labor market is tight and employers are having to meet employees’ demands for higher wages, average hourly earnings of private-sector employees have been growing in the four percent to five percent range y/y. In February, they grew 5.1 percent. This is on a nominal basis. Factor in inflation, and the picture is not as rosy. Real average hourly earnings in January contracted 1.8 percent y/y. This was the 10th straight monthly loss of purchasing power (Chart 4).
In the end, growth either way likely suffers, and this is hardly a consensus view. The Ukraine situation has caused some to toy with the idea of imminent recession, but the majority continues to believe that last year’s momentum carries into this year and next.
The sell-side as a matter of fact expects growth in S&P 500 operating earnings to accelerate to 9.5 percent next year from this year’s expected 8.7 percent – $244.32 next year versus $223.13 this year.
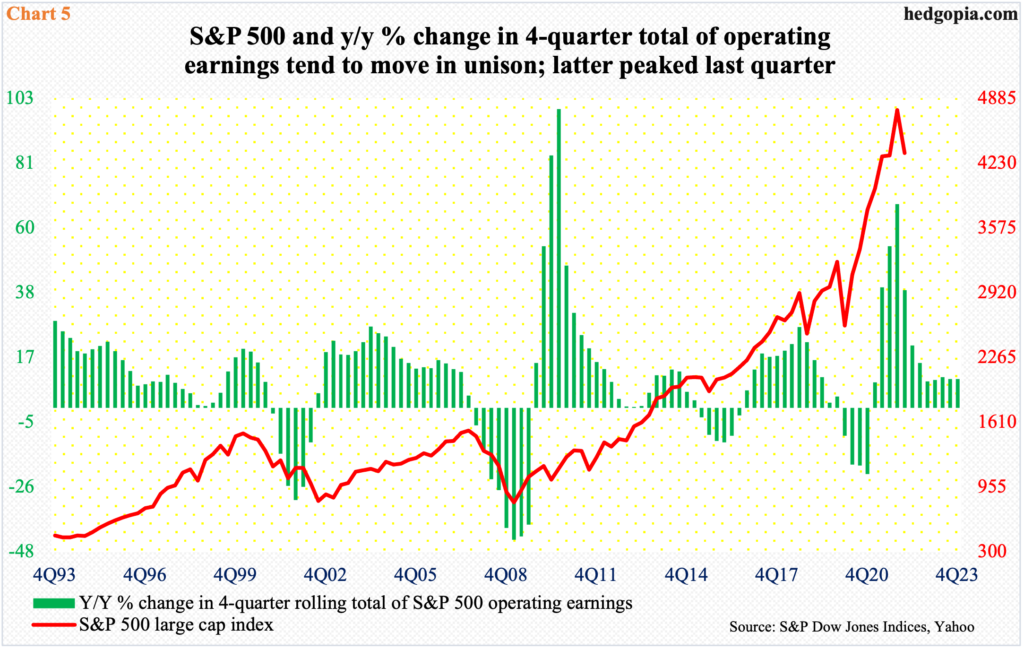
There is this, though. The y/y growth rate in earnings peaked last quarter at 67.8 percent and is expected to decelerate in the out quarters (Chart 5). In the past, this metric and the S&P 500 have followed each other closely. Should history repeat itself, there is a long way to go before the index bottoms.
This is the risk medium- to long-term facing US stocks. Sentiment has taken a hit, but from high to low, the S&P 500 has not even dropped 15 percent. In the near term, ahead of the FOMC meeting next week and amidst Ukraine-related headline risks, bulls could be looking for opportunities to go long.
Thanks for reading!
