
The 1Q earnings season begins in earnest this week, with a host of financials getting the ball rolling. For large-caps, this year’s revision trend is flat to slightly up, but next year’s is decidedly up, which is kind of interesting considering a hawkish Fed. Revealingly, next year’s estimates for small-caps are weakening.
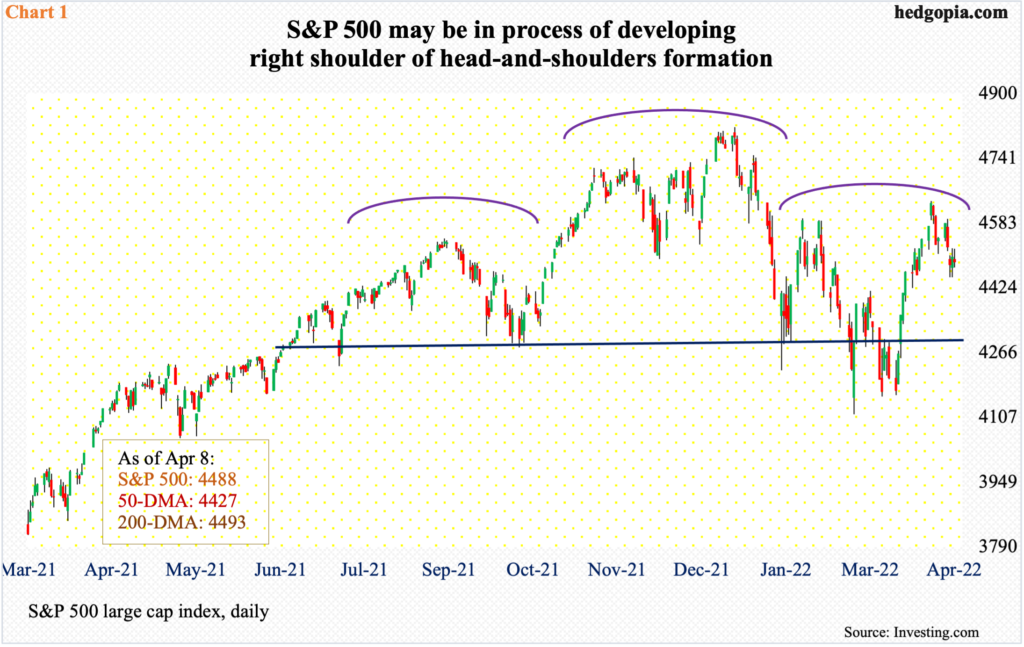
After three up weeks, with the first two solid, the S&P 500 shed 1.3 percent last week. At Tuesday’s high, the large cap index was up one percent, while at Wednesday’s low it was down 2.1 percent. On Wednesday and Thursday, bulls showed up at 4450. Bears, on the other hand, should continue to show up at 4550-4600. There is dual resistance at 4550s.
The index dropped from 4819 on January 4 to 4115 on February 24. A 61.8-percent Fibonacci retracement of this decline lies at 4550. This level also approximates horizontal resistance. Plus, the 200-day moving average lies just underneath at 4493.
Last week, the 200-day was breached on Wednesday, reclaimed on Thursday and lost again on Friday, albeit barely, with the index closing at 4488. As the bulls and bears fight it out for control of the average, the S&P 500 could be in the process of forming the right shoulder of a head-and-shoulders pattern (Chart 1).
Things are evolving this way as the S&P 500 companies get ready to report their first-quarter results. Financials will get the ball rolling next week, with JP Morgan (JPM) reporting on Wednesday, and Wells Fargo (WFC), Citigroup (C), Goldman Sachs (GS) and Morgan Stanley (MS) on Thursday. Bank of America (BAC) reports next Monday.
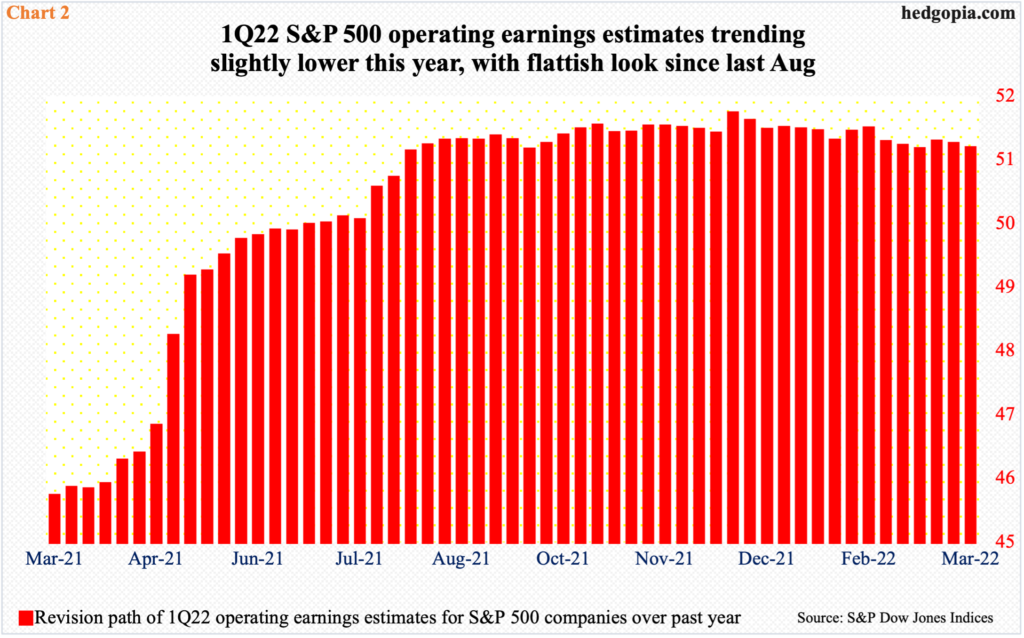
Ahead of this, 1Q operating earnings estimates for S&P 500 companies ended the quarter at $51.17, down $0.29 from where the quarter began. Estimates have trended slightly lower since the mid-December high of $51.72. In fact, they have gone sideways since last August (Chart 2).
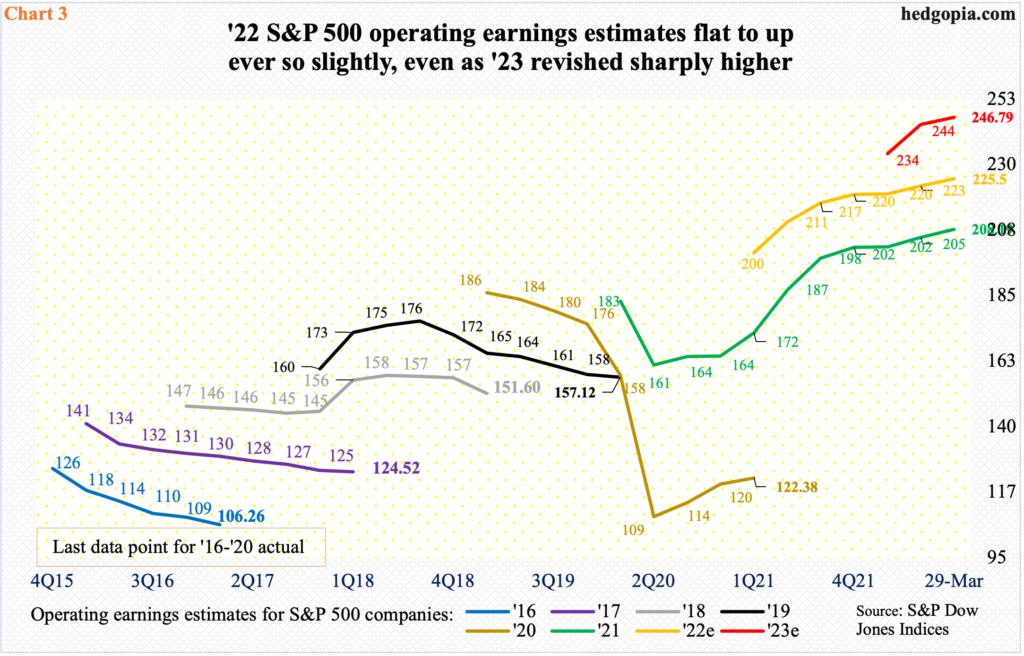
As far as 2022 goes, S&P 500 operating earnings are expected to grow 8.3 percent to $225.50. In 2021, these companies brought home $208.19, up from the Covid-impacted $122.38 in 2020.
Here is the kicker. In 2023, the sell-side expects earnings to expand 9.4 percent to $246.79, which was revised higher from $234.23 over less than three months (Chart 3).
The optimism around next year’s earnings raises a lot of eyebrows given the headwinds the US economy is likely to face in the face of an aggressive Federal Reserve – aggressive in the way of tightening not easing.
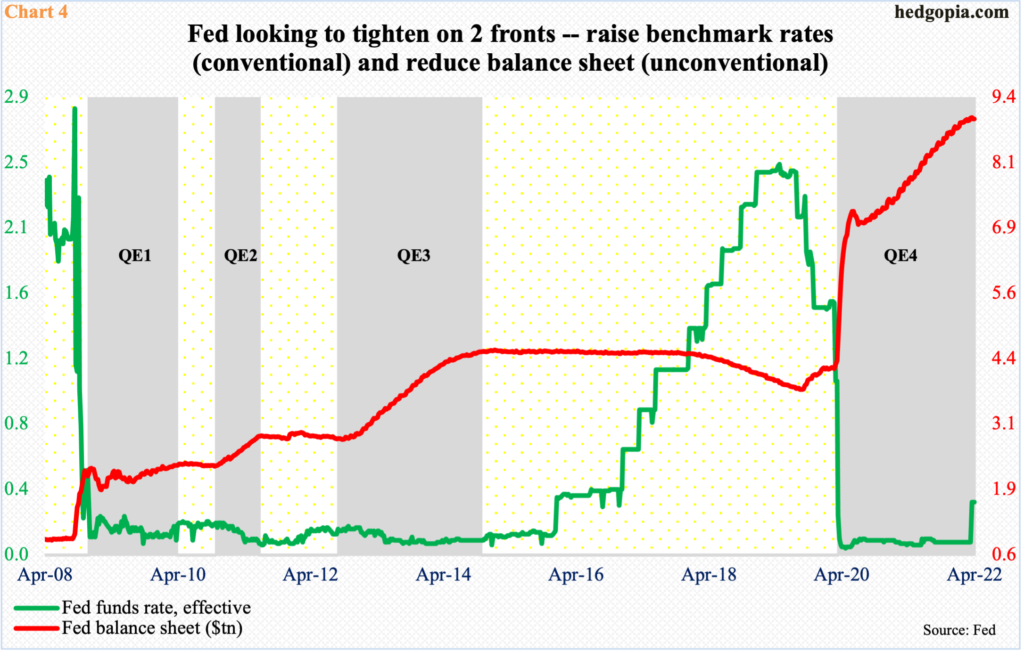
In March 2020, as the virus brought the global economy to its knees, the Fed showered the US system with liquidity using both conventional and non-conventional tools (Chart 4). The fed funds rate was abruptly pushed lower to a range of zero to 25 basis points – essentially zero-bound – even as it aggressively began buying treasury securities and mortgage-backed securities (MBSs).
In early March back then, the central bank held $4.24 trillion in assets, which went on to more than double to $8.96 trillion by the week to March 23 this year, with last week at $8.94 trillion. Inflation – both consumer and asset – was one of the by-products of all this liquidity.
Consumer inflation – both measured by the consumer price index and the personal consumption expenditures – are at four-decade highs. The Fed now wants to take the punch bowl away. In the March 15-16 meeting, the fed funds rate was raised by 25 basis points. This was the first increase since December 2018. In the next May 3-4 meeting, a 50-basis-point is looking probable.
In the meantime, the minutes for last month’s meeting, out last week, revealed that the Fed plans to shrink its balance sheet by $95 billion a month, comprised of $60 billion in treasury securities and $35 billion in MBSs.
In short, the Fed is no longer easing, rather tightening. And this is bound to reverberate through the economy, and by default corporate earnings.
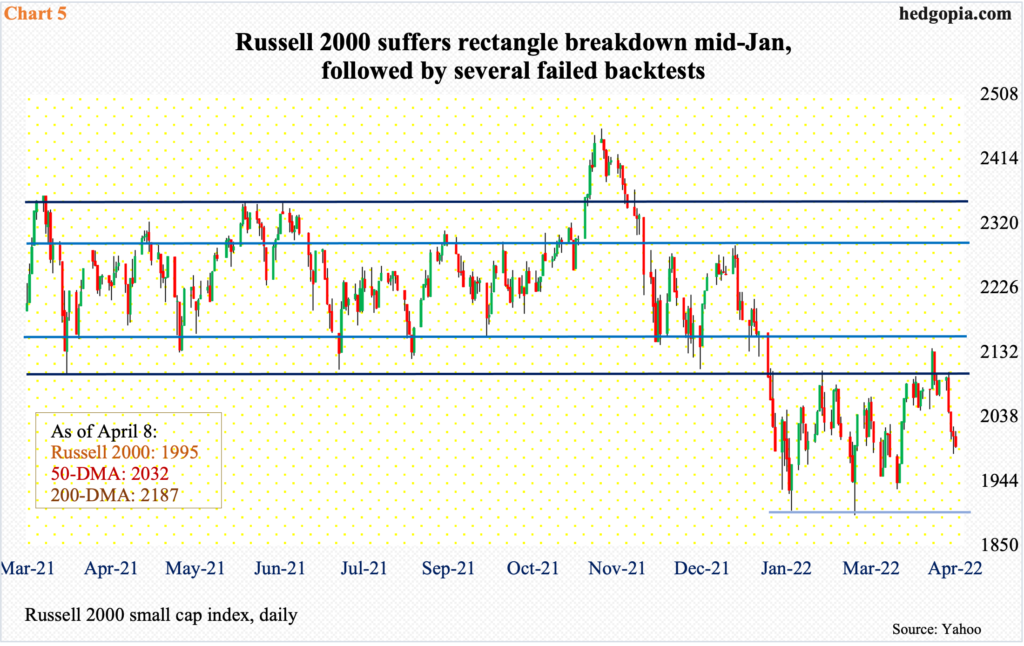
Small-caps inherently have a large exposure to the domestic economy versus their larger-cap cousins which also have international exposure. How these stocks perform at any given point can thus be taken as a reflection of how investors view the economy will shape up in the months and quarters ahead.
The Russell 2000 is not acting well.
From March last year through January, the small cap index was rangebound between 2350s and 2080s, and between 2280s and 2150s within this box. On Nov 3, it broke out but was quickly followed by a failed retest on the 19th (November). This was preceded by a range breakdown in January; the subsequent selling stopped near 1900, with a possible double bottom in late January and late February (Chart 5).
Since that breakdown, the index has tried several times to reenter the range, but several backtests have yielded no result.
Last week, the index rallied as high as 2103 intraday Tuesday, but ended down 4.6 percent to 1995. A test of the lows of January and February is likely in due course.
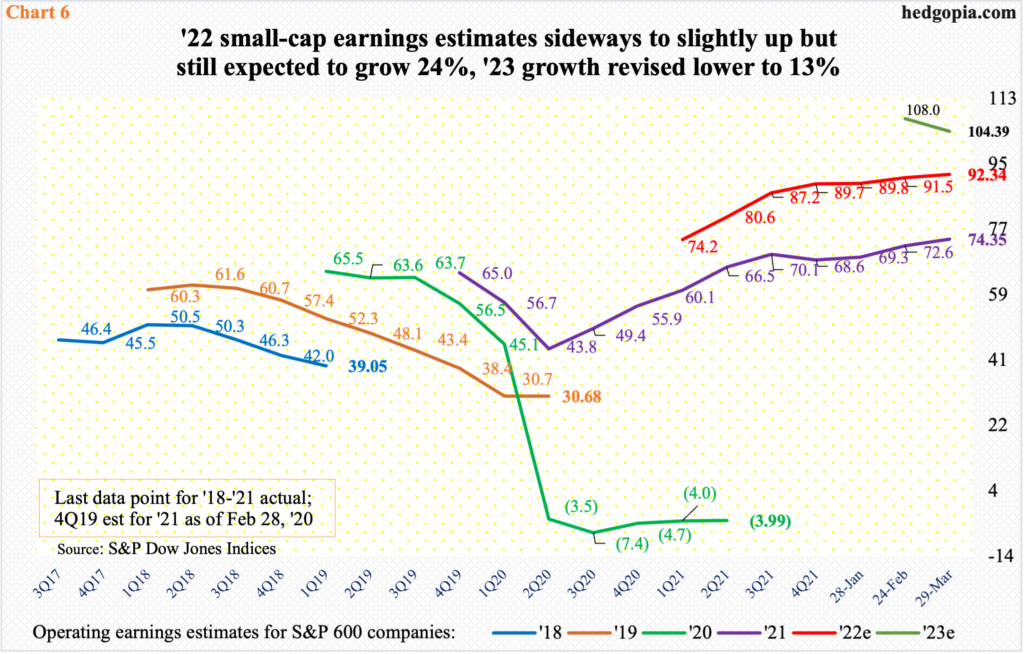
Concurrently, next year’s estimates are taking a beating.
In 2021, after losing $3.99 in operating earnings in 2020, S&P 600 companies earned $74.35. this year, the sell-side have them earning $92.34 – a new high and up 24.2 percent over last year. Next year, however, is another story.
In 2023, estimates as of the end of March were $104.39 (Chart 6), which still represents growth of 13 percent; however, toward the end of February, the sell-side had penciled in $108.64, for growth of 18.8 percent. All that enthusiasm is now gone. Even the current estimates could end up being too high given the new interest-rate dynamics.
With all that said, reality is yet to hit next year’s estimates for S&P 500 companies (Chart 3).
Thanks for reading!
