
Last year was a bumper year for stocks. Conditions are extended, sentiment effusive. History has taught us over and over again unwinding can be painful.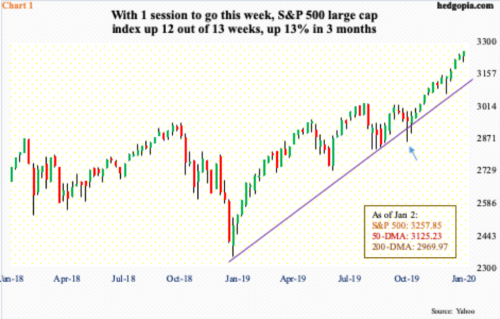
As soon as 2020 began, US stocks picked up where they left off 2019. In the year’s first session, the S&P 500 large cap index jumped 0.8 percent, the Dow Industrials 1.2 percent and the Nasdaq Composite 1.3 percent. The Russell 2000 small cap index was the only downer, down 0.1 percent. Too soon to say if the small-cap underperformance is a tell, but bears watching in the sessions ahead.
Indices remain overbought, with several indicators in out-and-out overstretched territory. The daily RSI on the Nasdaq has been north of 70 since the middle of December, with Thursday reading of just under 77 and 75.5 on the S&P 500. With one session to go, the latter is up 0.6 percent this week. Should it hold, this will be the 12th up week in 13. Just since last October (arrow in Chart 1), the index is up 13 percent.
This obviously has driven several other metrics well into overbought territory. Here are two.
Investors Intelligence bulls this week stood at 58.9 percent and bears 17.8 percent. Bulls have not been this high in 65 weeks (Chart 2). This week’s reading is the highest since early October last year when bullish sentiment peaked at 61.8 percent, just before the S&P 500 entered a three-month correction (Chart 1). By early January this year, bulls dropped to 29.9 percent. A week before that, the S&P 500 bottomed on Boxing Day.
Rapidly rising investor optimism is also reflected in the options market.
Chart 3 pits the 21-day moving average of the CBOE equity-only put-to-call ratio with the ISEE index. Barring divergences here and there, the two for the most part move together. Unlike the CBOE put-to-call ratio, the ISEE index is a call-to-put ratio, hence inverted. It excludes trades from market makers and brokers/dealers, and only uses opening long trades. Market makers need to hedge exposure all the time. Retail traders on the other hand bet on direction. Many consider the ISEE reading cleaner of the two.
Early September last year, the red line in the chart hit an all-time low of 105.1. Thursday, it closed at 155.1 – a two-plus-year high. The green line similarly ended Thursday at 0.56 – an 18-month low. This will get unwound. It is not a matter of if, but when. The deeper these metrics get into extended territory, the higher the likelihood of a painful unwinding.
Thanks for reading!
