- Recent WMT announcement notwithstanding, wage stagnation has been a trend
- 4Q14 U.S. non-farm output per hour goes negative – first drop since 3Q11
- Businesses can pay productive workforce higher wages and still win
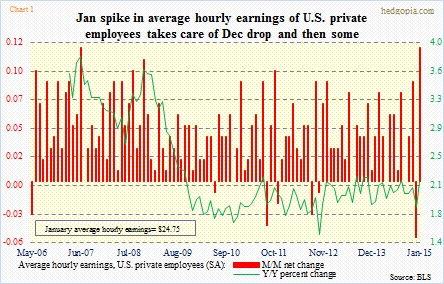
Later this morning, we get February’s U.S. employment report. Average hourly earnings will be in focus. January saw a rather nice spike, more than offsetting the December decline. But the overall trend has been stuck in the mud throughout this recovery (green line in Chart 1).
Recently there has been some good news, with companies like WMT announcing plans to raise wages (more here). But this is far from a trend (more here). At best, it has a sideways trend. So today’s report in and of itself is not going to change that, rather help us get a sense where things might be headed.
From this perspective, we got some data points yesterday. The Bureau of Labor Statistics released the final productivity numbers for 4Q14, and of course 2014. The year-over-year percent change in non-farm productivity was revised down during the quarter – from a previous flat to down 0.1 percent. Yes, productivity shrank in 4Q – the first decline since 3Q11.
This is a crucial statistic, and ties in to our discussion of wages.
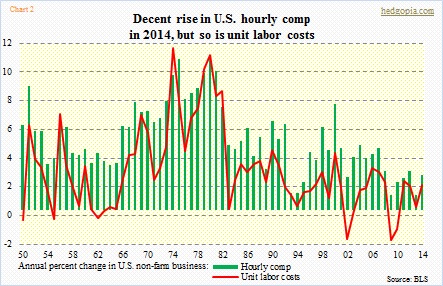
Chart 2 shows the annual change in hourly comp and unit labor costs in non-farm business. The latter is a function of hourly comp and output per hour – meaning between how much an employer is paid and how productive he is. Roughly speaking, unit labor costs, expressed in percent change, are equal to wages minus output per hour.
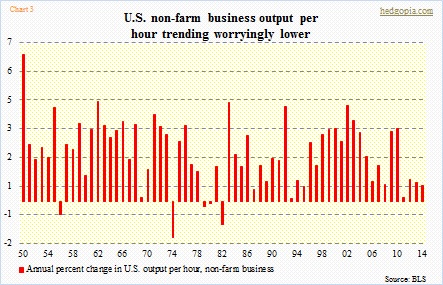
For instance, in 2010, hourly comp was up two percent. But because labor productivity rose 3.3 percent (Chart 3), unit labor costs in fact declined 1.3 percent. That is a productive workforce. In this environment, businesses would not mind raising wages.
Unfortunately, that is not what we have now.
In 2014, hourly comp increased a respectable 2.5 percent, versus 1.1 percent in 2013. The 2014 number, by the way, is in line with growth rates in average hourly earnings as well as the employment cost index. (Incidentally, the ECI includes both wages and benefits. Unit labor costs goes one step further, as it also includes such things as stock options.) In 2014, unit labor costs jumped 1.8 percent, from 0.3 percent in the previous year. Why? Because output per hour slid from 0.9 percent to 0.7 percent.
And that is the crux of the problem. The red bars on the right side of Chart 3 need to stop shrinking and begin to rise so businesses are comfortable giving a raise to their workers and at the same time not worry about margins (more here).

