
The major US equity indices have all accumulated massive gains over the last three weeks. Rallies of such magnitude over such a short period of time do not occur very often and come amidst a dichotomy of consumer confidence that just cratered to a new low and retail sales that set a new high.
Last week, the major US equity indices all broke out to fresh records, rallying relentlessly since bottoming on March 30. It is hard to make sense of this if we just focus on consumer confidence, which is cratering, but then again, several other macro datapoints are holding up just fine.
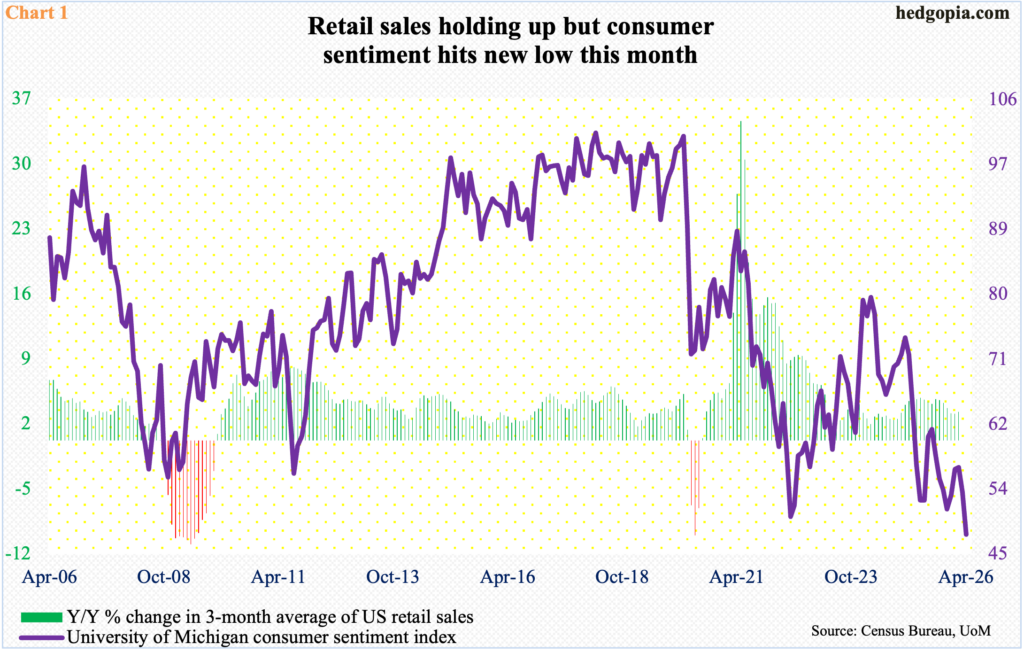
April’s preliminary count showed the University of Michigan’s consumer sentiment index tumbled 5.7 points month over month to a new low 47.6. Sentiment has been on the wane for a while now, so this is not just due to the ongoing Iran conflict, which has resulted in higher energy prices. Last November, sentiment dropped to 51, which was the second worst showing since the record low 50 reached in June 2022.
But it is not all doom and gloom. Arguably, consumers’ deteriorating confidence is not getting reflected in their spending behavior. February retail sales, for instance, reached a seasonally adjusted annual rate of $738.4 billion – a new record – with Chart 1 using a three-month average to calculate a year-over-over change. March sales will be out Tuesday, and this should help shed light on if the waning confidence is beginning to adversely impact sales.
Tech bulls are not in the least worried – not yet anyway. They took a hit in February and March but wasted no time in dusting off and galloping ahead this month.
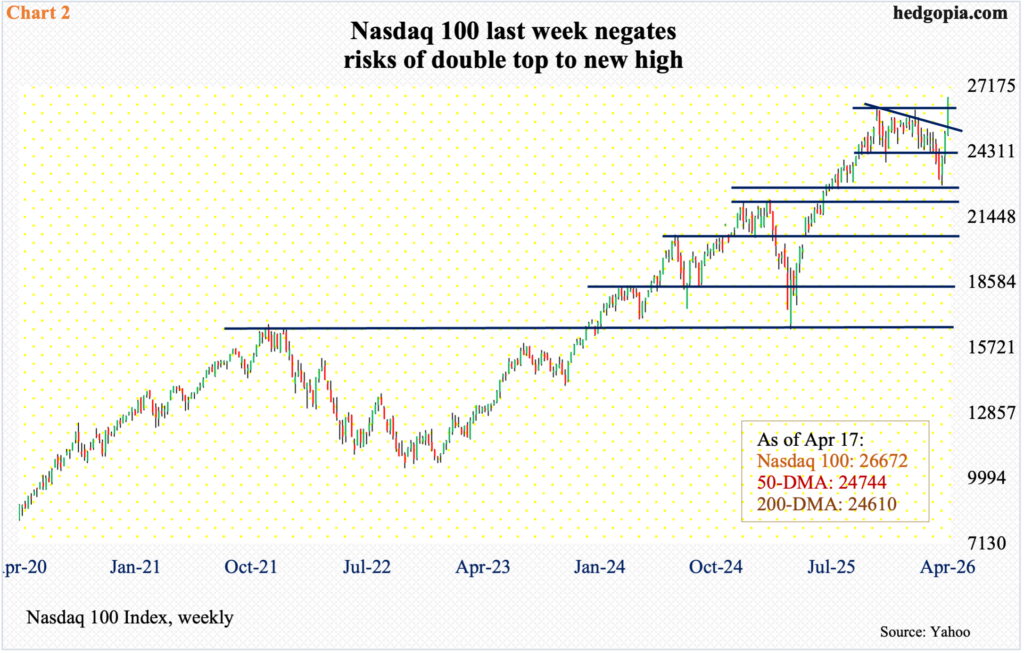
Last week, the Nasdaq 100 broke out to a new high – past prior two highs going back six months (Chart 2). On October 29, the index reversed lower after tagging 26182. Three months later, on January 28, bulls were within 17 points of that high but were flatly rejected. By March 30, the index then gave back 12.8 percent through the intraday low of 22841. Soon followed a parabolic run lasting 13 consecutive sessions through last Friday’s intraday high of 26720, shooting up 17 percent over the period. The latest run is the longest winning streak since 2013.
Last week, the Nasdaq 100 surged 6.2 percent to 26672, with its daily RSI north of 74; on March 30, this metric closed just under 30. This genuinely raises the risks of a pullback – at least in the near term – if nothing else just to unwind the daily overbought conditions the index finds itself in. Breakout retest at 26100s is key.
This week, of the Magnificent 7, Tesla (TSLA) reports its March quarter on Wednesday, while next week brings out results from five other heavy-weights – Microsoft (MSFT), Google parent Alphabet (GOOG), Apple (AAPL), Amazon (AMZN) and Facebook parent Meta (META); Nvidia (NVDA) does not report its April quarter until May. It is very possible sellers begin to show up ahead of next week’s results.
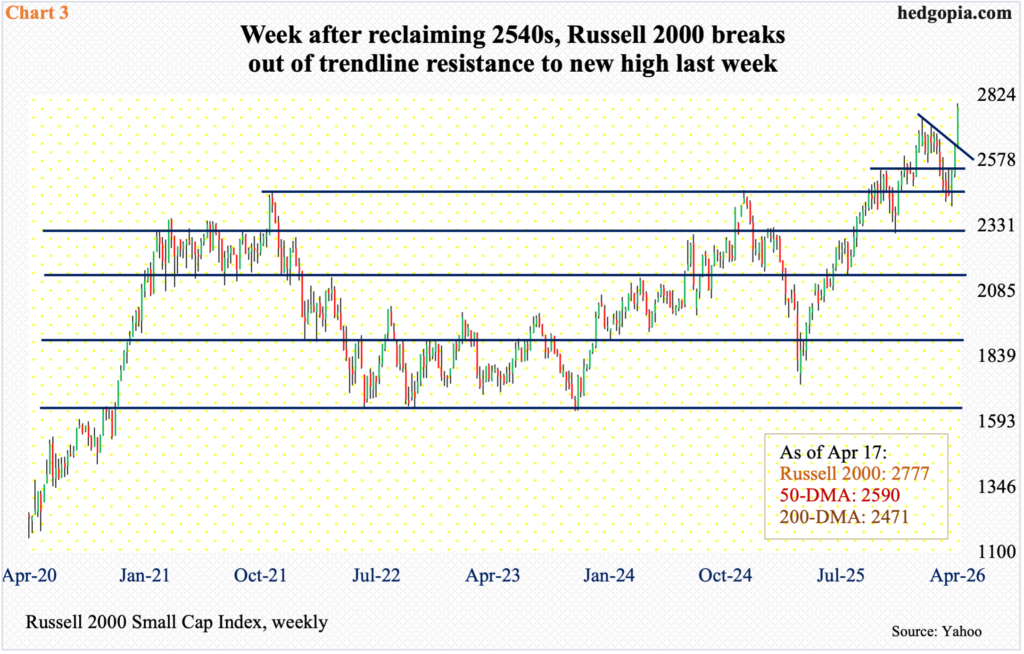
The story of a quick transition from ‘oversold’ to ‘overbought’ also holds true for the Russell 2000, which too broke out to a new high last week. The index had been making lower highs since peaking at 2735 on January 22. In the week before last, it closed right at a falling trendline from that peak. Last week witnessed a clean breakout, jumping 5.6 percent to 2777. On March 30, the small cap index bottomed at 2405 (Chart 3).
Earlier, a couple of weeks ago, the Russell 2000 decisively pushed through horizontal resistance at 2540s, which had stopped bulls’ breakout attempts for four successive weeks. Kudos to the bulls for pulling off the latest breakouts; they will be required to achieve yet another, which will be a breakout retest at 2730s – likely to occur very soon.
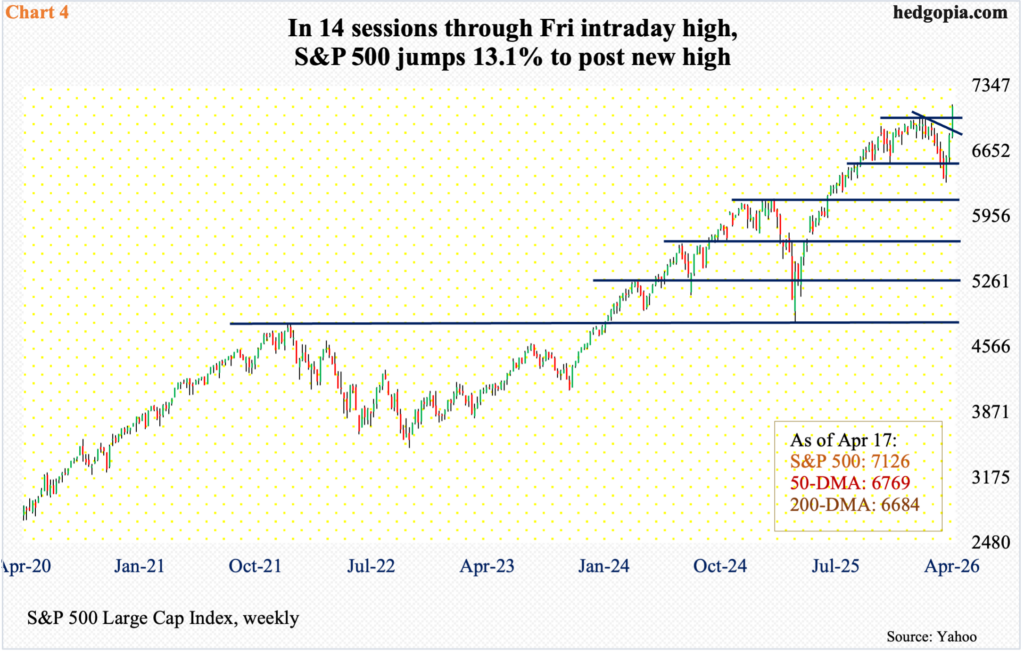
A similar fate probably awaits the large-cap bulls, with a breakout retest likely on the S&P 500 just north of 7000. Last week, the index added 4.5 percent to 7126, following gains of 3.6 percent in the week before and 3.4 percent before that (Chart 4). From the March 30 low of 6317 through last Friday’s intraday high of 7148, the index added 13.1 percent. This preceded a 9.8-percent decline from the January 29 high of 7002 and the March 30 low.
Arguably, the recovery from that low has come too far too fast, with the daily technical conditions way overbought currently. The daily RSI, to pick one, traversed from just under 30 to the low-70s in just 13 sessions, 12 of which were up sessions. Hence the significance of a successful breakout retest just north of 7000. Speaking of which, last Thursday’s intraday weakness was bought at 7009; bulls will need a repeat of that in the sessions ahead.
This likely gets trickier ahead, as bullish sentiment has catapulted higher in recent sessions. Nowhere is this more evident than in options.
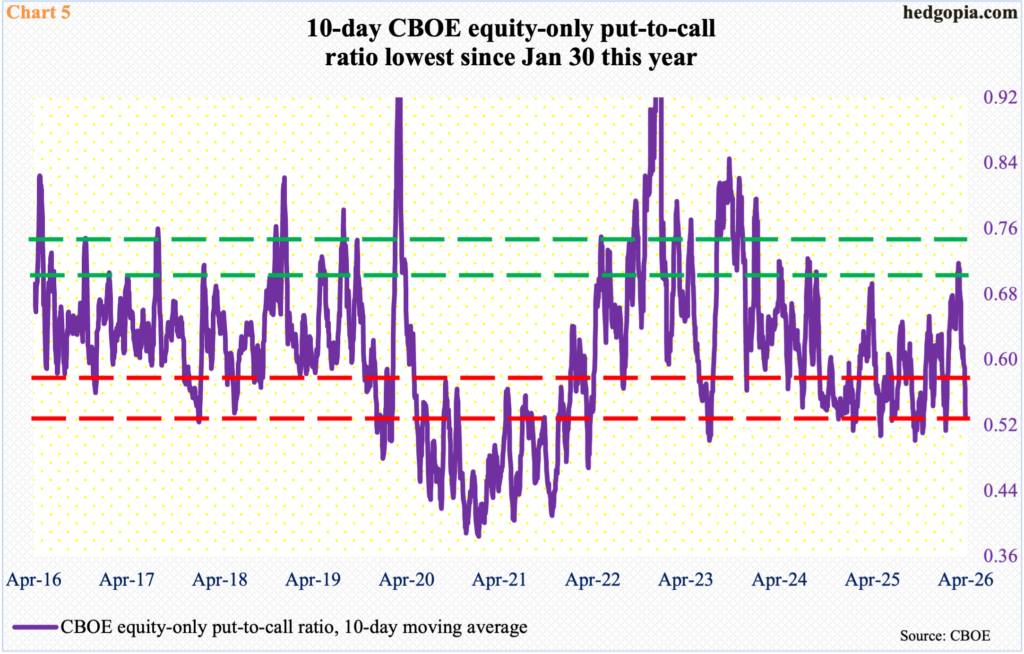
The CBOE equity-only put-to-call ratio produced a reading of 0.407 last Friday, which was the lowest count in three months, comprising of four consecutive readings of 0.40s; in the last eight sessions, there was one more 0.40s reading, and three more in the 50s, with two of them on the low side.
The 10-day moving average of the ratio came in at 0.529 last Friday, which again is the lowest in three months. From equity investors’ perspective, the 10-day average has dropped into the red zone (Chart 5). If past is prologue, it is always possible it continues lower in the sessions to come, but each tick lower raises the odds of unwinding, which, in turn, puts downward pressure on equities.
Thanks for reading!
