The Russell 2000 rose to yet another new high on Tuesday, having surged more than 120 percent since last March. A lot of optimism is built in. Earnings are expected to improve massively this year from last year’s loss. Be that as it may, the revision trend has gone flattish the past two and a half months.

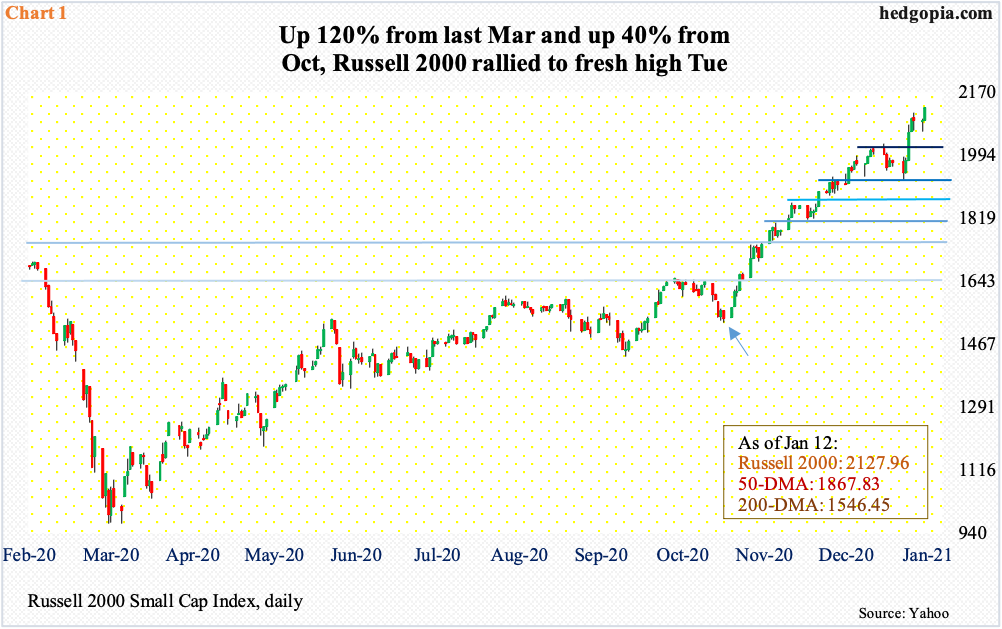
Tuesday saw the Russell 2000 post yet another record high. The small cap index closed at 2127.96, just slightly under the intraday all-time high of 2128.39. From October 30 when it bottomed at 1520s (arrow in Chart 1), the Russell 2000 is up 39.5 percent. Even before that, from March when it found support at 960s, it is up north of 120 percent – that is in 10 months!
In the wake of the November 3 presidential election and particularly after Pfizer (PFE) and Moderna (MRNA) delivered positive vaccine news – on the 9th and 16th that month – investor love for small-caps has gone vertical. By nature, small-caps have larger exposure to the domestic economy than their larger-cap cousins such as the ones represented by the S&P 500, which also has international exposure.
Technically speaking, the move the past two and a half months in particular has a parabolic look to it, but it also came in a stair-step fashion. Between then and now, the Russell 2000 took care of 1600-plus, which goes back to January 2018, and 1740s, which is where it peaked in August that year. These crucial breakouts were soon followed by several others, with the most recent being out of 2020s.

Also, on Tuesday, the NFIB (National Federation of Independent Business) reported its monthly report on small-business optimism. Going into this, optimism held up pretty well but not the outlook.
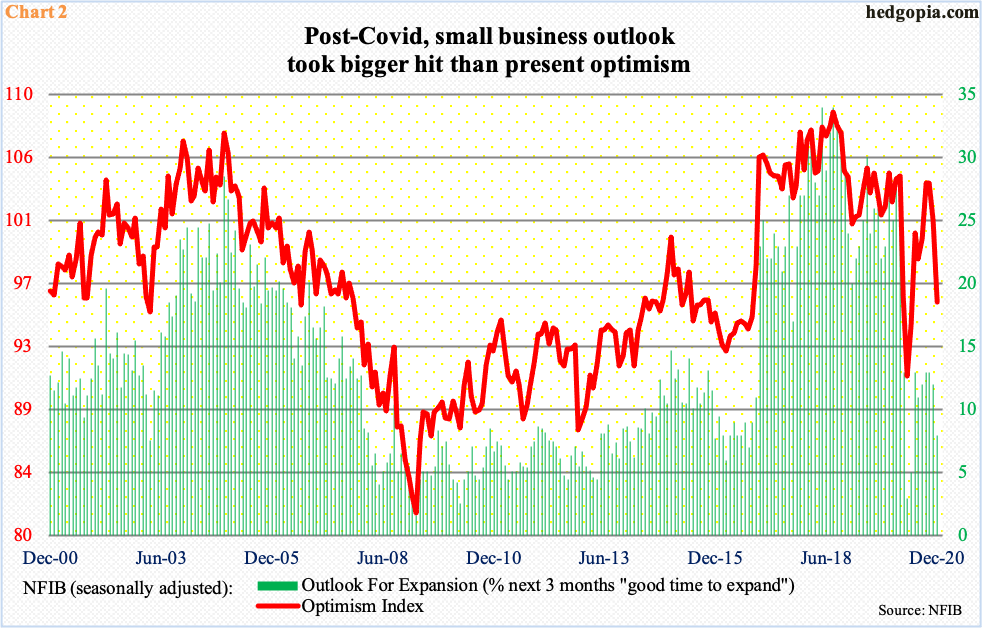
The NFIB Optimism Index fell from 104.5 in February to 90.9 in April, before recovering, with five of the six months through November north of 100. Concurrently, the Outlook for Expansion sub-index tumbled from 26 in February to three in April, before registering 13 in three of the six months through November. That is, post-Covid, small-business optimism recovered nicely, but these businesses were not as confident about their outlook (Chart 2). This continued in December – the main index down 5.5 points month-over-month to 95.9 and the outlook component down four to eight.
In other words, small-business optimism is not translating into better outlook. The two have diverged.

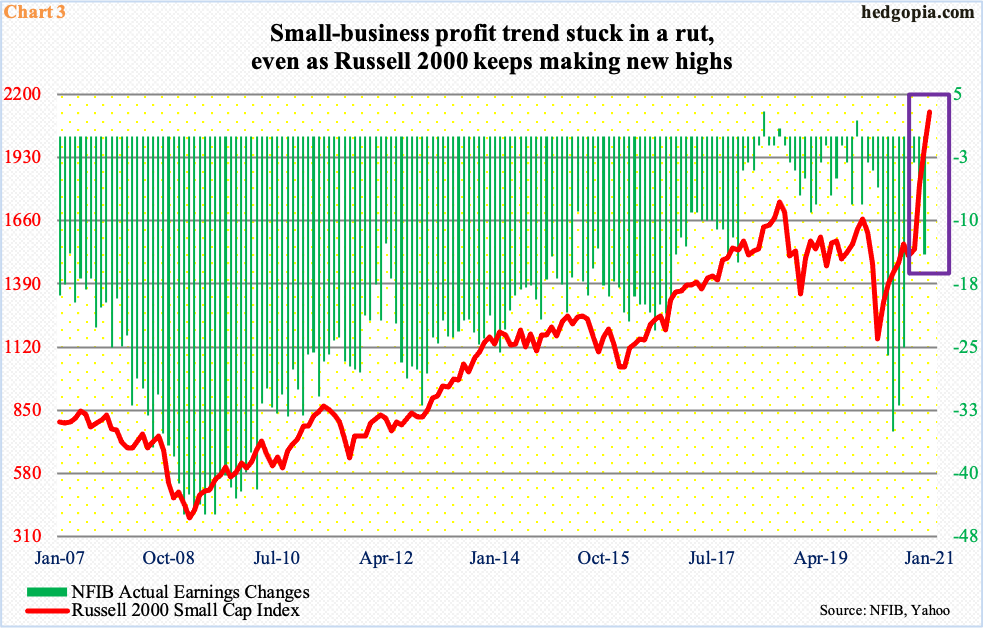
Divergence has also developed between the Russell 2000 and small-business profit trend (box in Chart 3). The latter is measured through the Actual Earnings Changes sub-index contained in the NFIB report. Historically, the two have tended to move together, but not this time.
In November 2019, the green bars rose as high as 2. By last June, they deteriorated to minus 35, before recovering to minus three by October; in the next two months, profit trend progressively worsened – first to minus seven and then to minus 14. In those two months, the Russell 2000 shot up 28.4 percent.
Investors are not the least bit convinced the current profit trend would continue.

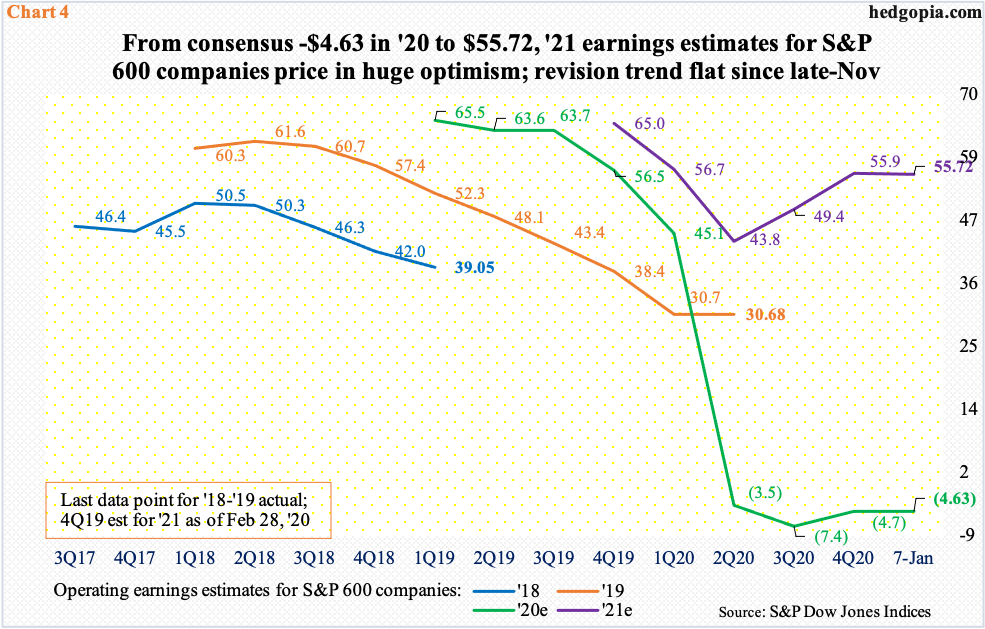
The sell-side has high expectations this year. If S&P 600 small cap companies end up earning the consensus $12.47 in 4Q, they would be losing $4.63 in operating earnings in all of last year. In 2019, these companies earned $30.68. This year, things are expected to improve by several orders of magnitude. As of last Thursday, they are expected to ring up $55.72, which, should they come through, would be a massive U-turn from last year’s dismal performance.
This is what small-cap investors are eyeing. Amidst this, two things are worth consideration. One, the sell-side is notorious for starting out optimistic and then bring out a knife as the year progresses. And two, the revision trend for this year has gone sideways since late November (Chart 4). Small-cap bulls would not want to see the trend persist, not particularly when they have built up so much gains on paper.
Thanks for reading!

