
The S&P 500 large cap index trades at 21.3 times operating earnings or 17.4 times or 15.5 times. Take your pick. The first one uses trailing 12-month earnings, and the latter two forward.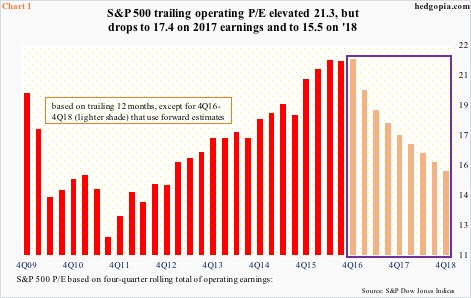
In Chart 1, the red bars are calculated off of trailing 12 months, and the lighter-shade bars off of forward 12 months.
In the current cycle, the trailing P/E progressively rose to as high as 21.4 in 2Q16, then dropping one-tenth of a point in 3Q16. Based on this, the S&P 500 is expensive.
Nonetheless, multiples progressively shrink if we were to use forward estimates.
Understandably, equity bulls prefer to use forward estimates, and the bears trailing. This helps serve their respective points of view.
In normal circumstances, using the discounted cash flow method, future cash flow/earnings can be discounted to the present. From this perspective, it makes sense to be using forward estimates. But these are not normal times – anything but.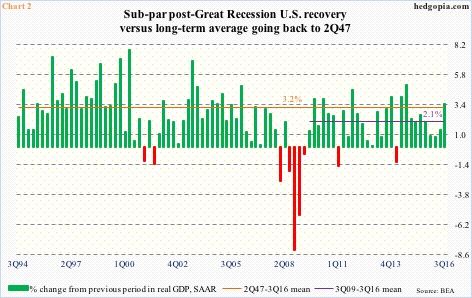
Post-Great Recession, economic growth has severely disappointed.
Between 3Q09 and 3Q16, real GDP only managed to grow at an average 2.1 percent – much weaker than the 3.2 percent average since 2Q47 (Chart 2).
Each year, the consensus expects growth to revert back to normal, and each year it meets with disappointment.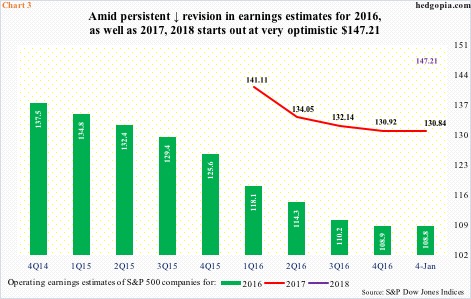
In keeping with this, like clockwork, the sell side initially expects robust earnings growth, only to persistently revise it lower as time passes.
Take 2016. In February 2015, operating earnings of S&P 500 companies were expected to come in at $137.50. Then came out the knives. As of the 4th this month, these estimates have been cut to $108.84. (The fourth quarter is just getting reported, so we do not yet have the final numbers for 2016.)
Or 2015 (not shown in Chart 3). In 2Q14, it was expected to earn $137.50 out of operations. When it was all said and done, the year only brought in $100.45.
Along the same lines, in January last year, 2017 was started out as $141.11, which has now been revised down to $130.84 (Chart 3). If both ’16 and ’17 estimates come through, ’17 would have grown north of 20 percent!
Amusingly, ’18 estimates just came out, and they are a whopping $147.21 (Chart 3). Once again, assuming both ’17 and ’18 estimates come through, ‘18 would have grown 12.5 percent.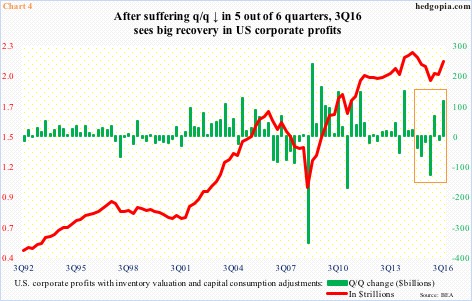
It is easy to be an optimist at this juncture. There are some signs ’17 estimates are beginning to stabilize, with estimates flat the past month and a half (Chart 3).
Also, in 3Q16, U.S. corporate profits adjusted for inventory and depreciation grew 5.8 percent quarter-over-quarter to a seasonally adjusted annual rate of $2.14 trillion. Since profits peaked at $2.22 trillion in 4Q14, they contracted q/q for four straight quarters as well as in 2Q16 (Chart 4).
This, plus President-elect Donald Trump’s plan to cut taxes and regulations as well as invest in infrastructure probably gives the sell-side conviction to stay aggressive with ’17, and now ’18, estimates.
That said, for every yin, there is a yang.
Energy has stabilized. But the dollar is strong. There likely will be fiscal stimulus in the Trump administration. But the Fed is likely to get more restrictive. Earnings for now may look to have stabilized. But the economy is in its eighth year of expansion.
With this as a background, it is awfully tough to value the S&P 500 on ’17 estimates, let alone ’18. The issue is not how high or low these estimates are. The issue is the likelihood of them getting realized. And on the latter, conviction lacks.
Thanks for reading!
