
Investor sentiment continues to remain exuberant even as, for the first time in a while, there is a chink in the S&P 500’s armor.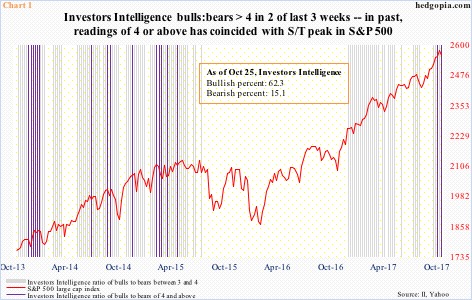
Investors Intelligence bulls this week jumped 2.3 points week-over-week to 62.3 percent. This was a third consecutive week of 60 or above and the highest since 63.1 in early March this year. Bears were 15.1 percent – matching a low of two weeks ago and the lowest since 14.9 percent in May 2015.
Sentiment is lopsidedly bullish.
Chart 1 plots the S&P 500 with Investors Intelligence ratios of three or above. In 32 out of 47 weeks beginning early December last year, bulls:bears has registered a ratio of three or above, two of them four or above.
A ratio of four or above – represented by violet bars in the chart – flashed twice in the last three weeks. The last four-or-higher reading took place in April 2015. It is rare. As such, at least going back four years, these occurrences have coincided with some kind of a top in the S&P 500.
This time as well, we could be in the midst of one.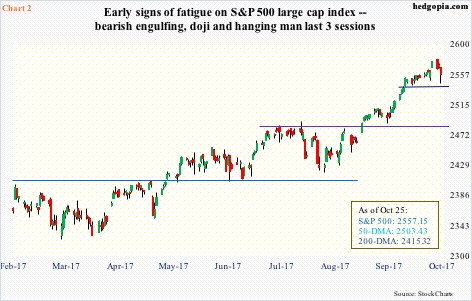
Intraday between the low of 2417.35 on August 21 and the all-time high of 2578.29 on October 23, the index rallied 6.66 percent, and has persistently remained overbought on nearly all timeframe.
Flows have fully cooperated.
Beginning August 21 through this Tuesday, three S&P 500-focused ETF’s, took in $14.1 billion, with SPY (SPDR S&P 500 ETF) attracting $7.7 billion, VOO (Vanguard S&P 500 ETF) $2.3 billion and IVV (iShares core S&P 500 ETF) $4.1 billion (courtesy of ETF.com).
In the week through Tuesday, $4.1 billion moved into these ETF’s. Week-to-date, the S&P 500 is down 0.7 percent. This was preceded by six up weeks. If weakness persists, this will be a test for these longs whether to hold on or lock in profit.
Importantly, some early signs of fatigue are beginning to show up on the S&P 500.
Monday, it rallied to a new high but not before producing a bearish engulfing candle. This was followed by a doji and then a hanging man. The latter can be an early indication that momentum is decreasing.
This might be what the RSI (14-day) could be suggesting. After remaining north of 70 for three weeks, it went sub-70 Wednesday; the bulls defended the 20-day moving average, but the 10-day has been lost.
This is an opportunity for the bears, especially considering sentiment is already way too complacent.
Thanks for reading!
