
Risk happens fast. All of a sudden, no one is buying the dip. Rather, the quest for protection has skyrocketed.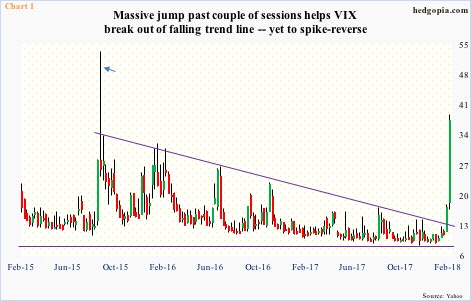
In mere six sessions, VIX went from 11.08 to 38.80, closing Monday at 37.32. This was the highest since August 24, 2015, when it surged to an intraday high of 53.29, only to close at 40.74 (arrow in Chart 1). That spike reversal marked the peak back then. Monday, VIX pretty much closed near the session high.
Importantly, a falling trend line going back to August 2015 has been broken on VIX. In fact, a similar trend line going back to late 2008/early 2009 has been broken as well. It is very possible volatility has entered a new – and higher – regime. It remained suppressed for quite some time.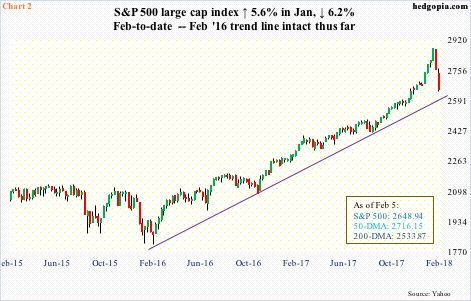
In this scenario, the current rout in stocks is more than a plain-vanilla decline.
Perhaps tellingly, the current selloff was preceded by record inflows in January.
On Monday, all major U.S. indices, including the S&P 500 large cap index, Dow Industrials and Nasdaq Composite, sliced through their respective 50-day moving averages. The Russell 2000 small cap index had already done so last Friday.
On the S&P 500, this was a first test of the 50-day in five months, and there were no bids waiting. Or, whatever there were simply got overwhelmed by the amount of sell orders. This possibly signifies a change in character.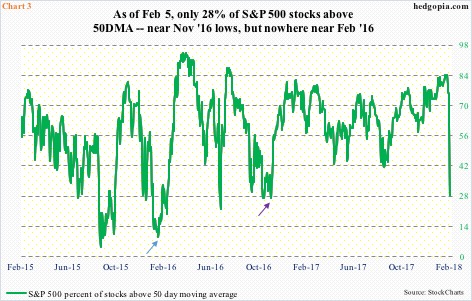
Some metrics are beginning to telegraph the panic out there. But have they reached extremes? That will depend on what timeframe we compare it with.
Chart 3 presents the percent of S&P 500 stocks above 50-day. It collapsed 32.4 percentage points Monday to 28 percent. This is about where the metric had dropped to in November 2016, before rallying (indigo arrow). That was the post-presidential election bottom. However, go back to January that year it dropped all the way to nine percent (blue arrow). Stocks reached a major bottom in January/February.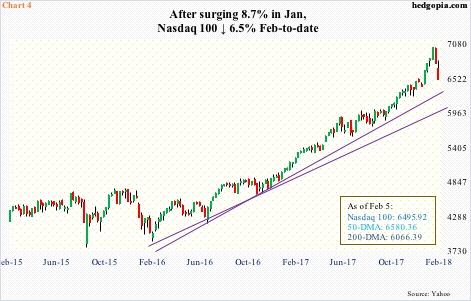
A trend line from those lows can provide some context as well, and is worth watching.
On the S&P 500 (2648.94), the trend line draws to 2600, or thereabouts (Chart 2). A loss of this trend line raises the odds for a test of the 200-day (2533.87).
On the Nasdaq 100 (6495.92), depending on how one draws a line from January/February 2016 lows, a test takes place at 6000-6200, which approximates the 200 day at 6066.39. By the way, Apple (AAPL), which commands a 10.6-percent weighting in the index, has already lost the 200-day.
When things stabilize, these broken averages will serve as easy pickings for shorts to reappear.
For now, one pretext used for the current wave of selling was the sudden backup in long-term Treasury yields this year. Ten-year yields broke past resistance at 2.62 percent mid-January. Monday, they reached 2.86 percent intraday but closed the session down six basis points to 2.79 percent. A case can be made that stability in these yields will soothe investor nerves. The long end of the curve is worth watching. As is, of course, VIX, where a spike reversal can signal imminent unwinding.
Thanks for reading!
