
Two different metrics and two different messages for equity bulls – one a clear warning and the other potentially helping them.
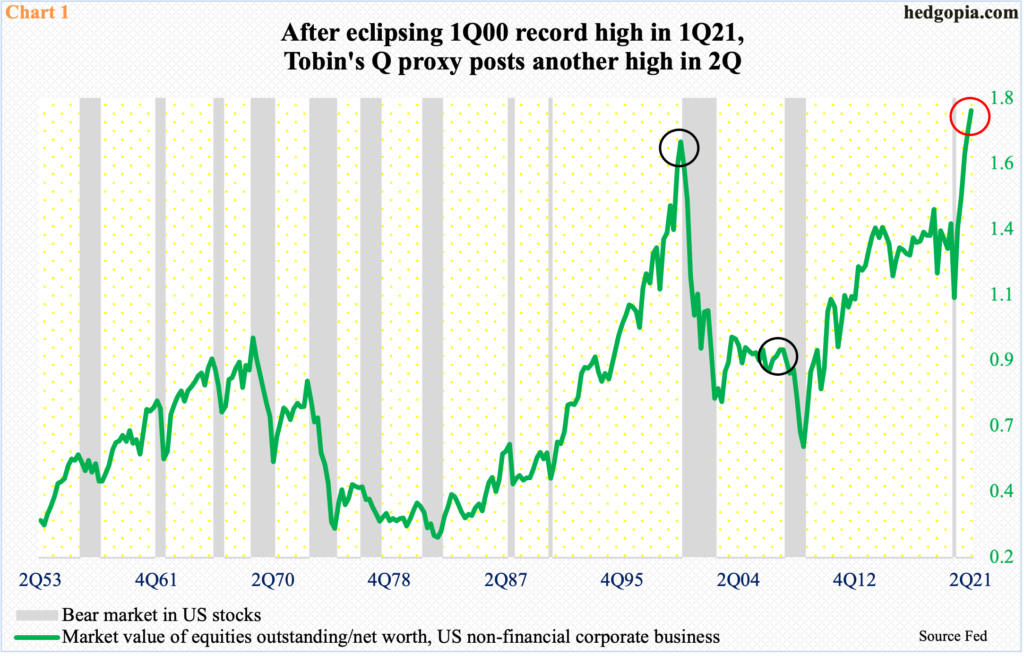
Tobin’s Q, which was propounded by economist James Tobin, is a popular investment concept. It compares an asset’s market value to its replacement cost. Things are in equilibrium when market value equals replacement cost. The higher the Q ratio, the higher the valuation.
In Chart 1, a proxy of the ratio has been generated by dividing US non-financial companies’ market value by their net worth. In 2Q this year, it registered 1.78 – a back-to-back record. In 1Q, the ratio rose to 1.71 to easily surpass the prior record of 1.67 from 1Q00.
Since bottoming at 1.12 in 1Q00, the Q ratio has absolutely gone vertical.
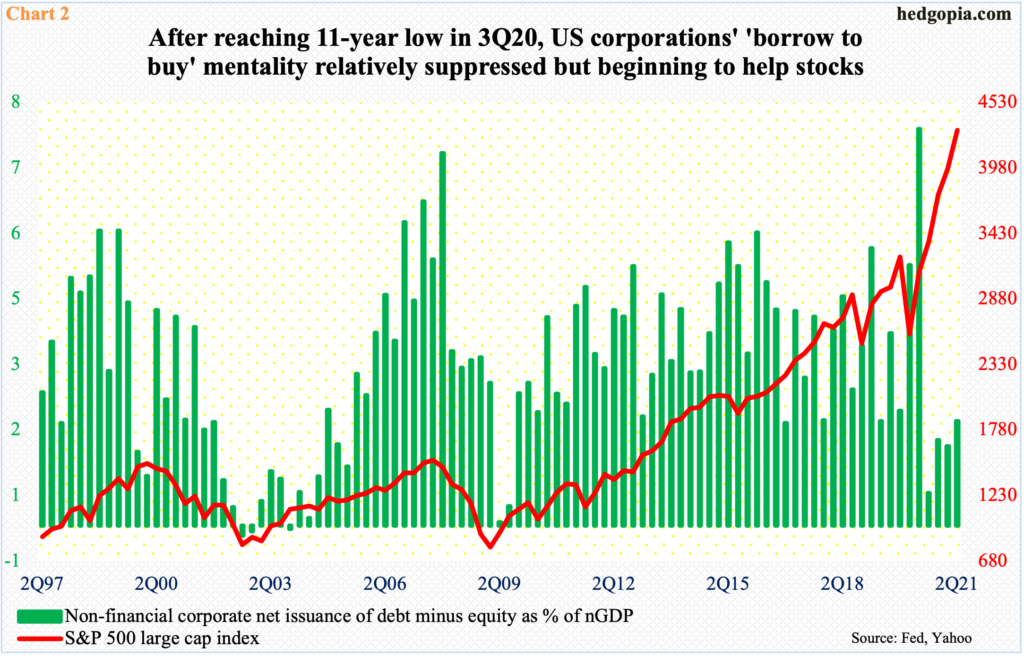
Chart 2 highlights one other metric which posted a new high four quarters and has since remained subdued – giving equity bulls hope that a sustained rise will help stocks.
The green bars in the chart represent a difference between corporate debt and equity issuance as a percent of nominal GDP. The idea is to see if corporations are borrowing to repurchase shares. It turns out they were doing exactly that at a record pace in 2Q20, with the metric reading 7.9; it then tumbled to 0.7 in the next quarter.
As a discounting mechanism, stocks can anticipate this and bottom early. The S&P 500 reached a major low in March last year. Back in 2002 and 2009, the large cap index bottomed in October and March respectively and the green bars in 3Q02 and 2Q09.
As things stand, the bars have plenty of room to continue higher, and this, if past is prelude, can help stocks.
Importantly, corporate buybacks are once again turning into a headwind. In 2Q, S&P 500 companies spent $199 billion in share buybacks (and $123 billion in dividends). This is quite a U-turn from four quarters ago when they purchased $89 billion worth – an eight-year low. As a result, the four-quarter total came in at $609 billion in 2Q this year, which remains substantially under the 1Q19 all-time high of $823 billion but much better than the $499 billion posted in 1Q this year.
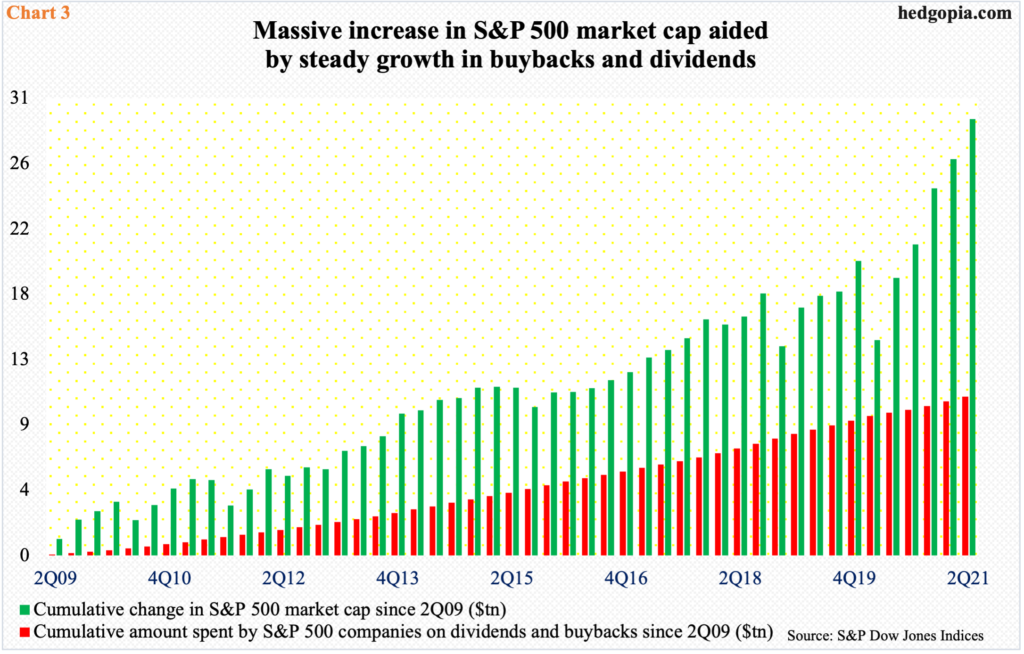
The significance of buybacks and dividends cannot be emphasized enough for US stocks. The bear market early this year was the shortest. Since 2Q09 when the prior bear ended through 2Q this year, the S&P 500 market cap has gone up by $29.4 trillion and the component companies’ spending on buybacks and dividends by $10.7 trillion (Chart 3).
Equity bulls will obviously cherish continued cooperation from buybacks, but they at the same time are increasingly having to fight elevated metrics such as the Q ratio.
Thanks for reading!
